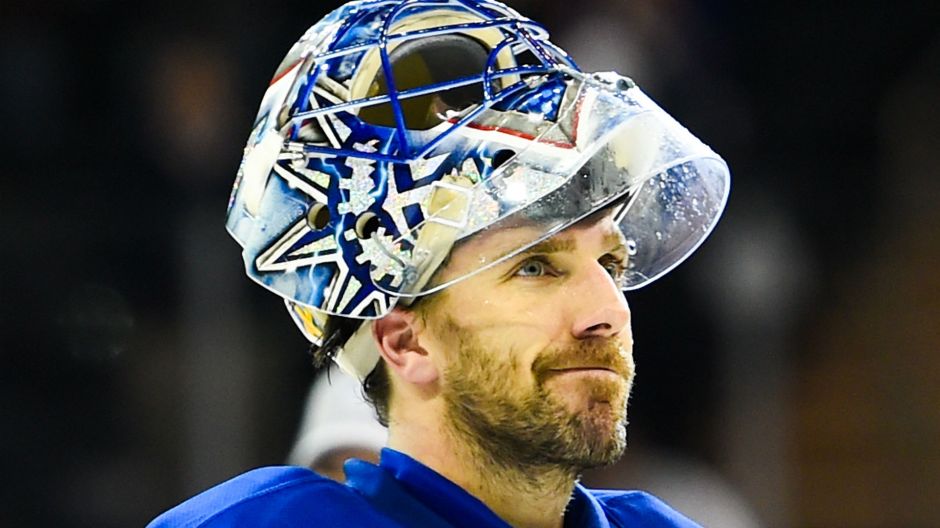
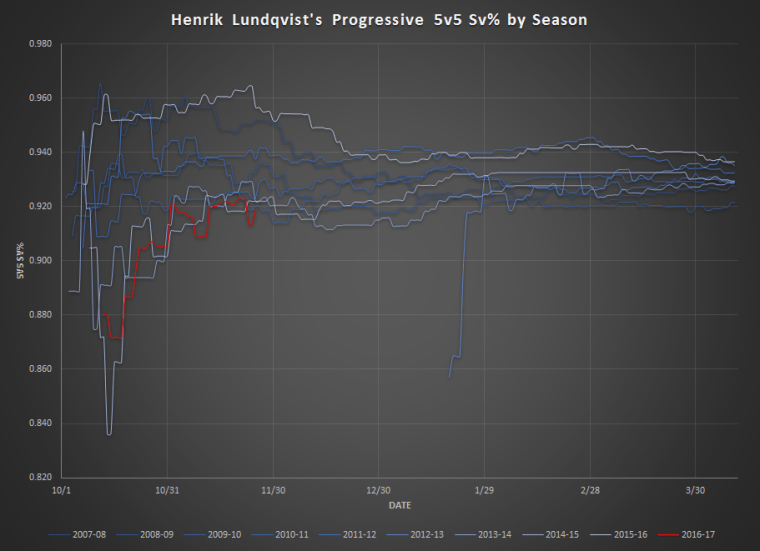
I looked at Lundqvist’s year-to-date stats back in late November and found that his play this year has been statistically weaker than every season since 2007-08 (which was the first season I could get the necessary data). I have added in the last five weeks of data and re-configured my graphs to make them a bit more reader friendly:
I looked at how Henrik Lundqvist’s play (a) has compared on a year-to-year basis and (b) how it tends to progress on a year-to-date basis. I used 5v5 Sv% and expected goals saved above average per 60 mins (xGSAA/60) as my two metrics. Both sets of data came from Corsica.
I chose 5v5 Sv% because it tends to eliminate a lot of team effects. All situations Sv% can be drastically affected by special teams based on the systems play that a team employs (as well as the efficacy at pulling it off). Overall, 5v5 Sv% tends to map decently year-to-year so it’s a good metric to look at as a measure of skill.
I chose xGSAA/60 because it helps address the issue of shot quality. xGSAA/60 basically looks at the types and distances of the shots taken and determines how many goals a hypothetical league average goalie would give up that night (ie, expected goals). By comparing this expected goals number against Lundqvist’s actual goals allowed number, we get an idea of how he performed against a league average baseline. The “per 60 mins” part helps to normalize for time in net. This stat is also only measuring 5v5 play.
I wanted to emphasize Lundqvist’s play this year against previous years as a composite so I chose colors that aren’t well differentiated for previous years (ie, 2007-16). However, if there is interest in having all of the years differentiated I can fulfill that request.
My observations:
Lundqvist isn’t doing well this year. His 5v5 Sv% is among the lowest of his career for this point in the season and his xGSAA/60 through yesterday is the worst of his career. There is some teeth to the idea that he is not playing at the same level as before.
His xGSAA/60 this year is very close to 0, suggesting that he is overall playing at a league average level during 5v5 play.
The idea that he is a slow starter is only true for the last few years. Earlier in his career he had solid starts to the season. There’s also a noticeable dip in almost every year for December, which is likely him cooling off from what looks like to be a lot of hot Novembers (just not this year).
His two best years by both stats appear to be 2015-16 and 2012-13. One year he received no votes for the Vezina while the other year he finished 2nd in voting. The Vezina voters really aren’t good at their job.
Honestly, I think it’s very fair to say we are seeing a below average performance from Hank relative to what we expect from him. This year he is facing a pretty normal mix of low-, medium-, and high-danger shots. It’s not like last year where the very high average shot quality he faced gave him average traditional stats and amazing underlying stats. Given the fact he’s coming off such a stellar season, I have a lot of hope that he can bounce back and play at a really high level this year.
However, going by the eye test I am at least a bit worried. There definitely have been games where he has let in total stinkers. And not just one stinker in one game, but a few stinkers in a few games each. But he still has long stretches where he plays solidly and makes great saves. Nonetheless, I would say there is not anything in particular that I see as an explanation for his poor play. No apparent injury or major changes in style of play. As far as I can tell, he’s more or less just playing more sloppy than usual.
Something I might investigate in the future is his progressive win threshold % (WT%) and loss threshold % (LT%). WT% is basically a measure of how often a goalie “steals games” and LT% measures how often they let in so many goals that the team in front is very unlikely to overcome it. Both are based on per game expected goals and goals against numbers. And at least for last year, he was absolutely elite by those numbers. One of the best in the NHL for both stats.
In this post I will evaluate this trade from the perspective of a New York Rangers fan. I plan to evaluate the following aspects of this trade:
Statistics-based performance review
Statistics-based usage review
Brief “eye test” statements
Contract, cap, and asset considerations
Concluding remarks
1. Statistics-Based Performance Review
Unless noted otherwise, all of the charts to follow were constructed using 2014-16 data for 5v5 situations with zone-, score-, and venue adjustments where applicable. The data has been sourced from Corsica. I will frequently use stats that say “/60”, which means the stat is adjusted to “per 60 minutes of time on ice.” This addresses any difference in time on ice by these players.
Here are some basic player data just to set the stage:
J.T. Miller became the first of four arbitration-bound New York Rangers to ink a deal. On July 13th, he signed a 2-yr, $2.75m AAV contract, leaving him just one year shy of UFA status. Many have proclaimed this contract is a steal for the Rangers, but I think it is right on point. I also believe it will provide a benchmark for many of the other players lined up for arbitration right now. Thus, I have used Miller’s contract to develop a simple cap hit prediction model for those other players.
For at least the last two years, the idea has been floated around that the New York Rangers play two different games: one when Lundqvist is in the net and one when he isn’t. That idea goes on to posit that the New York Rangers who show up when Lundqvist is off the ice is a much better team. Those Rangers create more offense knowing that they can’t just grind out low scoring, one goal games, and they play a tighter defensive game knowing that the King can’t just bail them out when they misstep. Overall, they play a better game of hockey without their safety net.
In this article I intend to begin looking into the notion that a team plays differently depending on who the goalie in net is. I will do so by examining something less directly tied to the goalie position. I will be looking at the GF60 and CF60 rates of three separate teams split based on whether their franchise goalie is in the net or not.
This idea isn’t without some cursory evidence. The Rangers were without Lundqvist for a sizable stretch in the 2014-15 season. A puck to the neck caused Hank to miss all of the Rangers’ games between Feb. 4th and March 26th, which was a 26-game stretch. Cam Talbot went on to shoulder much of the weight as the interim starter and ultimately he put up a great 0.926 performance. However, an early story line was the unexpected goal support from the Rangers for Talbot. From Feb. 10th to Feb. 22nd, the Rangers logged 33 goals in 7 games. And while they came back to earth shortly thereafter, the goal support still seemed to be there more for their goaltenders who aren’t named Hank. Talbot and MacKenzie stood in net for 38 games where the Rangers put up 3.04 GF60. Lundqvist received the slightly lower goal support of 2.89 GF60 over the course of 46 appearances. That came out to an extra 5.2% goals for Talbot and MacKenzie, which is an extra goal every 7 or so games.
Less Narrative, More Data and Graphs
I began by pulling 5v5 TOI, GF, and CF data for the New York Rangers’ goalies’ individual seasons from 2010-16, excluding 2012-13 (because the sample size is small for the lockout year). The data for guys besides Lundqvist were merged into a composite for each year.
The differences between the totals over these five seasons ended up being much larger than I expected. The Rangers scored an extra 0.23 GF60 in 5v5 play and generated 2.4 CF60 extra in 5v5 play when Lundqvist was on the bench or otherwise not playing. And in fact, the GF60 and CF60 data on a year-by-year basis was higher for the backups in 4 of the 5 seasons. The 5-year TOI totals were 16,202 min with Lundqvist and 5,758 min without. On a year-to-year basis, the TOI ranged from 2,225 to 3,088 min with Lundqvist and 743 to 1,785 min without. So the samples are decent in size.
Now, I do think this is compelling evidence that for some reason the Rangers are generally performing slightly better without Lundqvist in net. However, it is not possible to discern a reason from this data. Perhaps the players actually are more motivated to generate offense because they do not have their safety net. Perhaps the team’s coaches have made measurable changes to their personnel choices, such as decisions that are meant to try and keep the puck in the attacking zone. Perhaps the goalies themselves have significant contributions to the production, such as through stick handling.
To try and learn more about this apparent phenomenon, I investigated whether this situation has arisen on other teams. I chose to look at Nashville with Pekka Rinne and Chicago with Corey Crawford. Nashville, I thought, would provide a close parallel to the Rangers as both teams has generally been centered on an elite workhouse goaltender with a below average offensive team to support him. Chicago was to provide a stark contrast where I felt that Crawford was only depended upon to consistently deliver acceptable results and was infrequently leaned on to steal games. The Blackhawks tend to depend more on their offensive capabilities than the Rangers or Predators do, meaning that goaltending need not be as prized in Chicago.
The results were quite contrary to my expectations. The Predators, who seemingly would need to emphasize offense more without their star goaltender in net instead have mostly faltered in Rinne’s absence. Chicago, on the other hand, ramped up their production when they didn’t have their starter in net. It seems that the Blackhawks seek to capitalize more on their scoring opportunities to help support their backups.
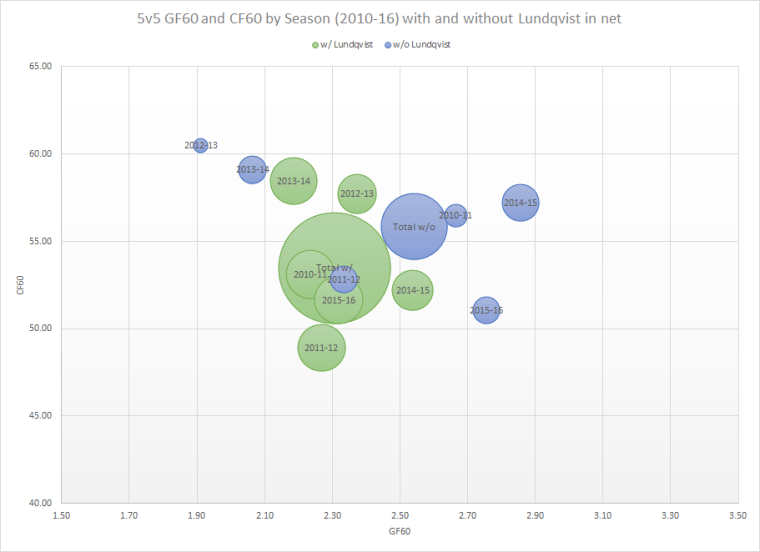
Below is another look at the data. These graphs give direct year-by-year comparisons of the data for all three franchises with and without their starting goalie:
The GF60 data seems really noteworthy. For all three teams, 4 of the 5 dots fall on one side of the line. In the case of the Rangers and Blackhawks, they fall above the line, where offense is up when the starter is out. The Predators see a dip in production on all but one year when Rinne is off the ice.
The CF60 data mirrors the trend for the Rangers and Predators. However, the Blackhawks see their CF60 drop in 3 of the 5 years without Crawford in the net. This is starkly different than what was seen in the GF60 data.
Closing Statements
I intend to investigate this idea further with other teams that have had a consistent starter across the past six-year period (e.g., Pittsburgh, Los Angeles, Dallas, etc). I will avoid teams that have significantly switched their starters in that period to try and avoid adding yet another set of variables into this analysis. Even someone like Lehtonen will be pushing it as he has effectively gone from being the #1 goalie in Dallas to a 1A/1B goalie this past year.
I know the Rangers better than I do any other team in the league so they would be the best team for me to dig deeper on this matter. I have a suspicion that personnel choices by the coaches may be a significant driver of what was observed for the Rangers. However, failing that I can also look into “puck luck” in those games. It is possible that what we’re seeing is just an aberration by pure chance.
Ultimately I think something like this could be an important part of understanding how a major roster change could affect a team in indirect ways. There could be an argument made that moving Lundqvist for a slightly above goalie could be a better change than would be expected than just by the GA60 and salary cap impacts. There is evidence that that a slight GF60 bump could occur, which would in part mask a rise in GA60.
While the history of the Penguins and Rangers is not enough for them to consider each other rivals, they certainly have shared some heated events and interesting connections in the past. In this article, I will cover some of the noteworthy events and players these two teams have shared over the last 49 years in anticipation of their third playoff series in three years.
Past Incidents
David Shaw slashes Mario Lemieux in the throat.
The first major incident between the two teams happened on October 30, 1988. David Shaw of the Rangers made a two-handed slash across Mario Lemieux’s neck. Lemieux immediately went down and remained down for a few minutes. Pat Quinn of the Penguins went right after Shaw, brandishing his stick as a weapon. Quinn speared Shaw before the two ended up grappling and quickly went down to the ice.The entire Penguins bench got as close to Shaw as they could without jumping the boards as Shaw was escorted by them to the locker room.
The third period of that game would tally 282 PIMs and 9 game misconducts between the two teams as two separate brawls erupted in the last 5 minutes of play. Shaw would later received a 12-game suspension for his slash, which was the 3rd-longest suspension in league history at the time.
Adam Graves breaks Mario Lemieux’s hand with a slash.
In Game 2 of the 1992 Patrick Division Final, Adam Graves delivered a heel-first two-handed slash onto Lemieux’s left hand. Graves was only given a minor in game, but was hit with a 4-game suspension afterwards by the league. Those four games would be all it took for the Penguins to win the series 4-2. Lemieux was out of the line up for two weeks before returning in Game 2 of the Eastern Conference Final against the Boston Bruins. Lemieux would score 8 points in the last three games of that series sweep. Lemieux would tally an additional 7 points in the Pens’ sweep of the Chicago Blackhawks for their second consecutive Stanley Cup.
Lemieux, when asked about the play some days later, commented that he thought the Rangers coach, Roger Neilson, had sent someone after him to hurt him intentionally. Lemieux said there was no question in his mind about that.
Lundqvist vs Crosby
The most notable aspect of the Rangers-Penguins match-up as of late has been the ongoing feud between Henrik Lundqvist and Sidney Crosby. While the two superstars seem to have a lot of respect for what the other has accomplished, they have a seething dislike for each other, which has culminated in a few unusual outbursts through the years. Most notably, there is the March 4, 2010, incident where Lundqvist called Crosby out for a suspected dive and a May 11, 2014, incident in which Lundqvist doused Crosby with water during a scrum.
Tortorella fined for comments about the Penguins
During a playoff game on April 5, 2012, Derek Stepan received a knee-to-knee hit by Brooks Orpik. In the post-game interview, Tortorella ripped hard into the Penguins organization and earned himself a $20,000 fine from the league. Crosby’s response was rather cool-headed with a touch of frustration.
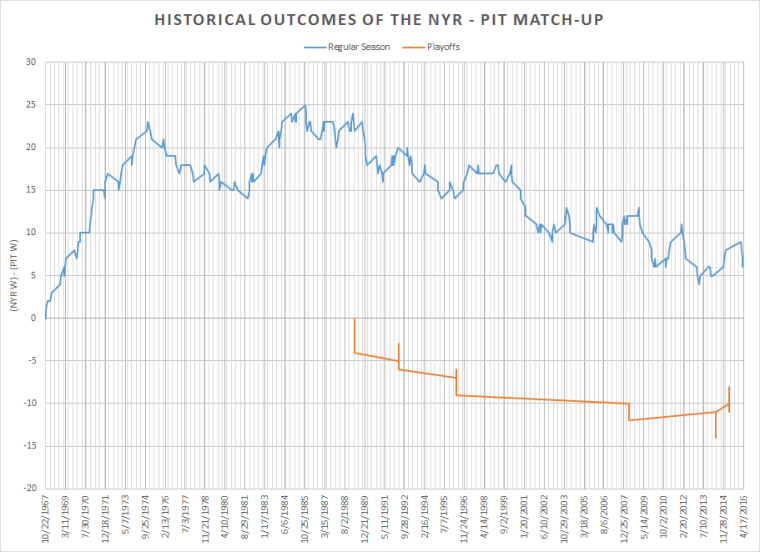
Regular Season Match-Ups History
The Penguins entered the league in the 1967 Expansion and first faced the Rangers on October 22, 1967. They lost 6-4, which was a respectable loss for them against an Original 6 team that year. They would manage to tie the Rangers 2-2 in their third match-up on February 10, 1968. It wouldn’t be until their 8th meeting on February 5, 1969, that the Penguins would first overcome the Rangers.
The Penguins struggled against the Rangers for years after entering the league. By the end of 1974, the historic match-up between these two teams favored the Rangers with 29 wins, 5 losses, and 7 ties. But the tide would change from then on. The Penguins regrouped to find three victories and only one loss to the Rangers in 1975 and they would continue that trend for years to come. Between the start of 1975 and 1981, the Penguins found 15 victories, 9 losses, and 5 ties.
While the Rangers found some periods of resurgence against the Penguin, their winning percentage would gradually slip over the decades. Today, the Rangers sit ahead of the Penguins with 120 wins, 32 ties, and 114 losses. (Quick note: I counted shootouts as ties.) At their height in 1989, the Rangers had 24 more wins than losses against the Penguins. Today they sit only 6 regular season victories ahead of their rival.
More Importantly: Playoff Match-Ups History
It was not until the 1981-82 season that the Rangers and Penguins were placed in the same conference (and division). Prior to that, the only opportunity for these two teams to meet in the playoffs was in the Stanley Cup Final and that simply did not happen. However, even then it took until 1989 for these two teams to find each other in the playoffs. By then, the Penguins were led by three 100-point scorers (most notably, Lemieux with 199 pts) while the Rangers’ best talent was a budding Brian Leetch who captured the Calder with 71 pts in 68 games played. Unsurprisingly, the Penguins swept the Rangers in the first round.
The Penguins would win additional series against the Rangers in 1992 (where they went on to win the Stanley Cup), 1996, and 2008. However, the Rangers have reversed that trend with a 4-3 series win in 2014 and a 4-1 series win in 2015.
Notable Shared Players Throughout the Years
This year’s rosters will include five players who are playing against their former squad. The players and their stats for when they played for their upcoming opponent are as follows:
Interesting note: The Rangers traded Pascal Dupuis on February 27, 2007, to the Atlanta Thrashers along with their 3rd round pick in 2007. That 3rd round pick was then included in a deal between the Thrashers and Penguins. The Penguins ultimately selected Robert Bortuzzo with that pick that originally belonged to the Rangers.
Jarogmir Jagr
The most prolific player to have spent time on both teams would have to be Jarogmir Jagr. Jagr is a historic figure in both franchises. He sits second in career games played, goals, assists, and points for the Penguins, behind only Mario Lemieux. He was a core piece of the Penguins team for 11 years, including the two Stanley Cup teams he played for in his teenage years. Jagr won five Art Ross trophies, two Pearson trophies, and one Hart trophy with the Penguins.
While Jagr was only a Ranger for four years and only won a Pearson trophy with them, he is remembered as one of their greatest players. He holds their single season records in goals and points. He elevated a team that was outside the playoff bubble into the post-season (even if only for a first round exit) in his four years with the Rangers.
Trading Partners in the 90s: Zubov, Nedved, Samuelsson, Robitaille, Hatcher, Kovalev, and Stevens
The Rangers made a significant trade with the Penguins in 1995 to try and repeat their 1994 Stanley Cup run. The Rangers gave up Sergei Zubov and Petr Nedved in exchange for Ulf Samuelsson and Luc Robitaille.
Ulf Samuelsson as a former Rangers enforcer and current Rangers assistant coach.
Zubov and Nedved would combine for 233 points in 218 games with the Penguins. Through a 1996 trade for Kevin Hatcher, Zubov found his home in Dallas. Hatcher was then traded from the Penguins to the Rangers on September 30, 1999 for Peter Popovic.
Nedved returned to the Rangers via another trade in 1998 that sent Alexei Kovalev to the Penguins with some additional, lesser pieces going each way. Kovalev would be part of an eight-person trade back to the Rangers by the Penguins in 2003.
Robitaille would produce 117 points in 146 games with the Rangers before a 1997 trade for former Penguins star Kevin Stevens sent Robitaille to Los Angeles for his second of three stays with the Kings.
Samuelsson would stick with the Rangers for four years and accumulate 60 points and 475 PIMs in 287 games. He was traded to Detroit in 1999 for a package of draft picks. Samuelsson is presently an assistant coach with the New York Rangers.
Andy Bathgate
Finally, Rangers legend and Hall of Famer Andy Bathgate played for both franchises. Bathgate was a long-time Ranger who was the Rangers’ leading scorer from 1956 to 1963. As a result, he sits at fourth in career goals, assists, and points for the Blueshirts.
By the time the 1967 Expansion Draft came, Bathgate was playing for the Red Wings, who decided to leave him unprotected. The Penguins claimed him in the 19th round as the 112th overall pick. Bathgate scored the first goal of the Penguins franchise and led the team in scoring for their inaugural year. The Penguins would play him for one more year before trading him to the Vancouver Blazers of the WHA.
In 2009, the Penguins selected his grandson Andy Bathgate, III, with the #151 overall pick in the 5th round of the entry draft. The younger Bathgate is currently playing for the Columbus Cottonmouths of the SPHL. Unfortunately, the elder Bathgate passed away on February 26, 2016, at the age of 83.
In today’s NHL the idea of a player-coach is completely far-fetched. Both sides of the bench have become highly specialized and have demanding such responsibilities that you rarely find the player who can “do it all” on the ice and likewise for coaches in the locker room. In fact, we’re at a point where each team might have a head coach, two or more assistant coaches, a goaltending coach, and a support staff (such as video coaches and scouts). Likewise, players are expected to not only train physically, but also practice, and learn systems for all sorts of situations. Between the enormous increase in coaching responsibilities as well as the commitment fo rplay on the ice in today’s highly structured game, it’s unlikely we’ll ever see a player-coach in the NHL again.
So let us take time to reminisce about some of the more noteworthy NHL player-coaches in history.
Newsy Lalonde, 1917-22
Despite playing much of his early career before the NHL was formed in 1917, Newsy Lalonde was one of the league’s first star players. He scored 125 goals in only 99 career games and would have been both the Art Ross Trophy and Rocket Richard Trophy winner in 1918-19 if those awards had existed. Lalonde was an early captain of the Montreal Canadiens and was on their first Stanley Cup winning team in 1916 (in the National Hockey Association). He coached the Habs for 88 games from 1917-22, which included an NHL Championship win in 1918 (but not a Stanley Cup as the Cup was not necessarily tied to the league until 1926). After this he played for the Western Canadian Hockey League before returning to the NHL to coach for the New York Americans in 1926-27. In November 1926 he substituted into the game for an injured player, marking his final game as a professional hockey player in any league. He would return to coaching in 1929 with the Ottawa Senators before returning to coach the Canadiens from 1932 to 1935. Lalonde finished with a 144-167-28 record as an NHL coach. He was elected to the Hockey Hall of Fame as a player in 1950.
Lester Patrick, 1928
Known as one of the league’s most influential coaches of all time (he introduced the blue line, forward pass, and the playoff system to the NHL to list just a few of his laurels), Lester Patrick only played a single game in the NHL and he did so as a player-coach. The 44-year old, who was in his first year as New York Rangers head coach, substituted himself into a Stanley Cup Final game after starting netminder Lorne Chabot suffered an eye injury from a high shot. Back then, teams did not have backup goaltenders. The opposing coach, Eddie Gerard of the Montreal Maroons, refused to allow either of the two professional goalies in the crowd (Alec Connell, star goalie for the Ottawa Senators, and minor-leaguer Hugh McCormick) substitute for the Rangers, leading Patrick to get in front of the net himself. Odie Cleghorn, who was coach of the Pittsburgh Pirates at the time, was in the stands and allowed to substitute for Patrick on the bench. Cleghorn told the Rangers to play a hard checking game the rest of the night, which kept the Maroons from getting shots close on net. Patrick made 18 saves on 19 shots, leading to the Rangers’ victory. The Rangers were able to get a league-approved replacement goalie for the remaining three games of the series, which they won to bring home the club’s first Stanley Cup championship. Patrick went on to win six Stanley Cups as a player, coach, and manager. He was elected into the Hall of Fame in 1947.
Cy Denneny, 1928-29
Player-coaches in the early NHL were somewhat common because coaching was not as complex as it is today and because teams had tighter budgets than they do now. Perhaps the most prolific player-coach of the early days was Hall of Famer Cy Denneny. Denneny was signed by the Boston Bruins in 1928 as a player, coach, and assistant manager. He led the team to their first Stanley Cup championship, his fifth and final one of his career, in 1929. Denneny was one of the most prolific goal scorers of the early NHL and at the time of his retirement in 1929 he held the career records in goals and points in the NHL. Denneny would round out his NHL career with two years as a referee from 1929-31 and a year as the coach and manager of the Ottawa Senators in 1932-33. After a last place finish with the Senators, Denneny moved on from hockey.
Frank Boucher, 1943-44
Frank Boucher became a player-coach for the New York Rangers in 1943-44 under very odd circumstances. At the time, Boucher had already been retired for six years. He is one of the Rangers’ greatest players of all-time as he had won two Stanley Cups as a player (1928, 1933) and another as a coach for the team (1940). However by 1943 the Rangers were the worst team of the league. The Rangers were actually so bad that Boucher came out of retirement to become a player-coach. At the age of 42, Boucher played 15 games and scored 14 points. The Rangers still finished with a 6-39-5 record, one of the worst in history by a non-expansion team. This was mostly due to their 6.20 GAA, which is the worst the league has ever seen. Boucher would continue coaching the basement dwelling Rangers through 1949, when he was let go after a 6-11-6 start on that season. He would return again in 1953-54, but after a 14-20-6 record his coaching days would come end. He was elected to the Hockey Hall of Fame in 1958.
Other early player coaches include: Eddie Gerard (1917-18, Ottawa Senators), Ken Randall (1923-24, Hamilton Tigers), Odie Cleghorn (1925-1928, Pittsburgh Pirates), Duke Keats (1926-27, Detroit Cougars), Art Duncan (1926-27, Detroit Cougars), Dunc Munro (1929-31, Montreal Maroons), Lionel Conacher (1929-30, New York Americans), Sylvio Mantha (1935-36, Montreal Canadiens), and Dit Clapper (1945-47, Boston Bruins).
Sid Abel, 1952-54
Hall of Famer Sid Abel is best known for his time in Detroit, both as a player (for 12 years) and as a coach (for another 12 years), but sandwiched between those spans was a two year stint as player-coach for the Chicago Black Hawks. Abel was part of the famed “Production Line” in Detroit with Ted Lindsay and Gordie Howe. In 1950 the three of them would take the 1-2-3 spots as the league’s leading scorers, the only time three teammates have done such in NHL history. After winning his third Stanley Cup in 1952, Detroit traded Abel to Chicago for cash. Abel coached the full 1952-53 and 1953-54 seasons for the Black Hawks while also skating in 42 out of 140 possible games. Abel was released by Chicago after only amassing 9 points and a 39-79-22 record. He would be picked up by the Red Wings in 1958 and spend the next 811 games on the bench for Detroit before finishing his coaching career with 13 games split between the St. Louis Blues and Kansas City Scouts.
Doug Harvey, 1961-62
With seven Norris Trophies, Doug Harvey is one of the most accomplished defensemen in the league’s history. He was a pivotal part of the 1950’s Canadiens team that appeared in ten consecutive Stanley Cup Finals (1951-1960), winning one in 1953 and five consecutive Cups from 1956-60. It was after missing the SCF in 1961 that Harvey was traded to the Rangers for tough guy Lou Fontinato. In Harvey’s first season with the Rangers, he served as player-coach, skating in 69 games and coaching for 70 of them. He led the team to a 26-32-12 record while winning his final Norris and finishing second in Hart voting behind Jacques Plante. Harvey did not like the pressure created by the position and so he stepped down as coach before the 1962-63 season. This was the last time the NHL saw a player-coach fill both responsibilities for a full season. He would play another 154 games in the NHL, but he never coached again. He was inducted into the Hall of Fame in 1973.
Charlie Burns, 1969-70
Charlie Burns was the most recent player-coach the NHL has seen. On December 28th, 1969, he was named the head coach after Wren Blair was fired for leading the Minnesota North Stars to a 48-65-34 record in their first 2.5 years in team history. Burns coached the team for 44 games while also skating in 50 that year. Because I don’t have game logs to know when he skated, the best I can do is determine that he must have been a player-coach for a minimum of 18 games that season. Burns, a defensive-minded center, was known for his PK and checking abilities, would end up with 16 points as a player and a 10-22-12 record as a coach that year.
The 1969-70 season was not Burns’s first time as a player-coach. He served that role twice with the San Francisco Seals of the Western Hockey League (which is actually completely unrelated to the WHL we know today) in 1965-66 and again in 1966-67. His time as player-coach for the North Stars would neither end his playing or coaching career. He played with the North Stars through 1972-73. After spending a year in the AHL, Burns returned to the North Stars as a coach for a single year.
Honorable Mention: Arturs Irbe, 2014
While serving as the goalie coach for the Buffalo Sabres, Irbe was signed to a tryout contract on November 18th, 2014, to serve as an emergency backup goalie for the Sabres after Jhonas Enroth was injured in the first period while playing the San Jose Sharks. Irbe, who hadn’t played in an NHL game since April 4, 2004, suited up but did not play that night. Irbe had had a 13-year career that spanned 568 games. While his career 0.899 Sv% is terrible by today’s standards, he had a balance of seasons where his Sv% was above and below the league average. He was at times a rel workhorse, having lead the league with 70+ games started on three separate occasions. Had he taken to the ice in 2014, he would have become the first player-coach in 44 years and possibly the record holder for longest gap between seasons played (although that last part is speculation on my part).
Other Honorable Mentions: Todd McLellan and Joel Quennevile
McLellan only played 5 career NHL games and found himself overseas in the top Dutch hockey league by the age of 25. It was there with the team SIJ Utrecht that he served as a player-coach in 1992-93, sparking his interest for behind the bench. The next year he was a head coach for the North Battleford North Stars of the Saskatchewan Junior Hockey League. Over the next two decades McLellan worked his way up through the WHL and the AHL to become an assistant coach in Detroit, where he won the Stanley Cup in 2008. That next year marked the start of his first NHL head coaching assignment with the San Jose Sharks. McLellan is now the head coach of the Edmonton Oilers.
Quenneville served as an assistant coach to Marc Crawford in 1991 while he was still a player for the St. John’s Maple Leafs in the AHL. Quenneville had enjoyed an 803-game NHL career, but St. John’s general manager Cliff Fletcher was looking to transition him into a coaching role. Quenneville quickly worked his way up the ladder, joining the Quebec Nordiques in 1994-95 as an assistant coach and becoming a head coach of the St. Louis Blues in 1996-97. Now in his twentieth year as an NHL head coach, he has won more Stanley Cups (2010, 2013, and 2015 with Chicago) than he has had his teams miss the playoffs (just once: the 2006-07 Colorado Avalanche).


 Jarogmir Jagr
 Andy Bathgate
 Newsy Lalonde, 1917-22
 Lester Patrick, 1928
 Cy Denneny, 1928-29
 Frank Boucher, 1943-44
 Sid Abel, 1952-54
 Doug Harvey, 1961-62
 Charlie Burns, 1969-70
 Honorable Mention: Arturs Irbe, 2014
 McLellan only played 5 career NHL games and found himself overseas in the top Dutch hockey league by the age of 25. It was there with the team SIJ Utrecht that he served as a player-coach in 1992-93, sparking his interest for behind the bench. The next year he was a head coach for the North Battleford North Stars of the Saskatchewan Junior Hockey League. Over the next two decades McLellan worked his way up through the WHL and the AHL to become an assistant coach in Detroit, where he won the Stanley Cup in 2008. That next year marked the start of his first NHL head coaching assignment with the San Jose Sharks. McLellan is now the head coach of the Edmonton Oilers.
 Quenneville served as an assistant coach to Marc Crawford in 1991 while he was still a player for the St. John’s Maple Leafs in the AHL. Quenneville had enjoyed an 803-game NHL career, but St. John’s general manager Cliff Fletcher was looking to transition him into a coaching role. Quenneville quickly worked his way up the ladder, joining the Quebec Nordiques in 1994-95 as an assistant coach and becoming a head coach of the St. Louis Blues in 1996-97. Now in his twentieth year as an NHL head coach, he has won more Stanley Cups (2010, 2013, and 2015 with Chicago) than he has had his teams miss the playoffs (just once: the 2006-07 Colorado Avalanche).