The Rangers and Senators made a very noteworthy trade on June 18, 2016:
In this post I will evaluate this trade from the perspective of a New York Rangers fan. I plan to evaluate the following aspects of this trade:
- Statistics-based performance review
- Statistics-based usage review
- Brief “eye test” statements
- Contract, cap, and asset considerations
- Concluding remarks
1. Statistics-Based Performance Review
Unless noted otherwise, all of the charts to follow were constructed using 2014-16 data for 5v5 situations with zone-, score-, and venue adjustments where applicable. The data has been sourced from Corsica. I will frequently use stats that say “/60”, which means the stat is adjusted to “per 60 minutes of time on ice.” This addresses any difference in time on ice by these players.
Here are some basic player data just to set the stage:
| Brassard | Zibanejad | |
| Age | 28.8 | 23.3 |
| Height | 6’1″ | 6’2″ |
| Weight | 205 lbs | 220 lbs |
| Shoots | L | R |
| GP | 241 | 230 ( + 6 AHL) |
Zibanejad is younger and slightly larger than Brassard. Both have shown similar durability over the past three years. Brassard’s only major injuries during his pro career has been a dislocated shoulder in 2008. Similarly, Zibanejad’s only injury-struck pro season was in 2012-13, when he missed about 20 games in the AHL, battling a few injuries.
Possession Metrics
(Note: Expected goals (xG) is basically a possession statistic like Corsi but with adjustments for shot quality and some math magic to make it look like goal-based data rather than shot-based data. Some parameters of “shot quality” are shot type (e.g., wrist shot vs deflection), shot distance, and shot angle. A higher expected goals for (xGF) means better shot generation and a lower expected goals against (xGA) means better shot suppression. But the beauty is that it could mean a change in the actual volume of shots, the actual quality of shots, or both. A more in-depth explanation can found at Corsica.)
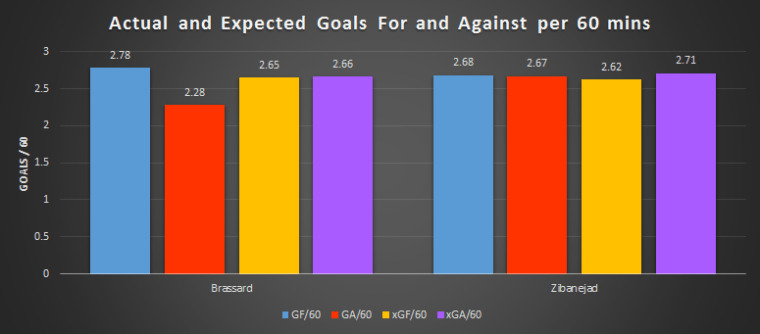
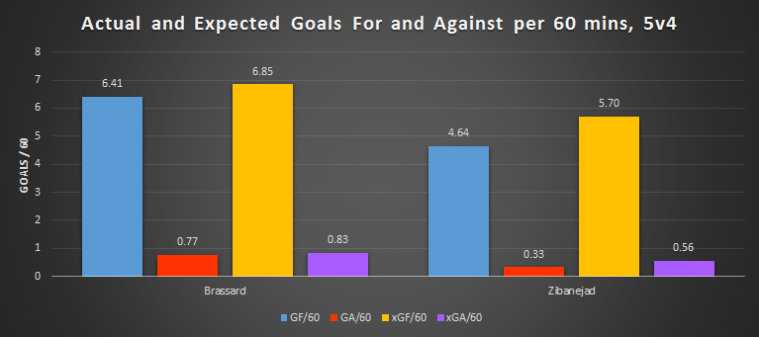
These two players have very similar xGF/60 and xGA/60 stats to the point where they are likely to be statistically indistinguishable. Basically, both players are generating and suppressing shot attempts/quality at about the same level and are doing so with equal rigor. Both players have a reputation for being mediocre defensively, but the numbers suggest that they are not generating more risk than they are generating reward.
Ultimately, though, it is goals for and goals against that decide who wins and who loses a game. Brassard has a clear advantage here as he is both is experiencing more goals for than expected and less goals against than expected. Zibanejad’s GF/60 and GA/60 closely match his expected rates. Brassard has better GF/60 and GA/60 than his xGF/60 and xGA/60. A lot of this comes down to the fact that most of the Rangers top players are “percentage players” rather than “possession players.” They convert on high quality shot attempts slightly more often than an average team and high quality shot attempts against them are stopped slightly more often than an average team. This is reflected in the fact that Brassard’s PDO is 101.2%, despite having an expected PDO of 99.8%. Zibanejad’s PDO and xPDO are much closer at 100.8% and 100.4%, respectively.
However, this does not dismiss the fact that Brassard generally has better GF/60 and GA/60 numbers than Zibanejad. Even the relative stats bear this out:
| Brassard | Zibanejad | |
| rel GF/60 | 0.43 | 0.25 |
| rel GA/60 | 0.33 | 0.27 |
| rel GF% | +0.38 | -0.21 |
Production Metrics
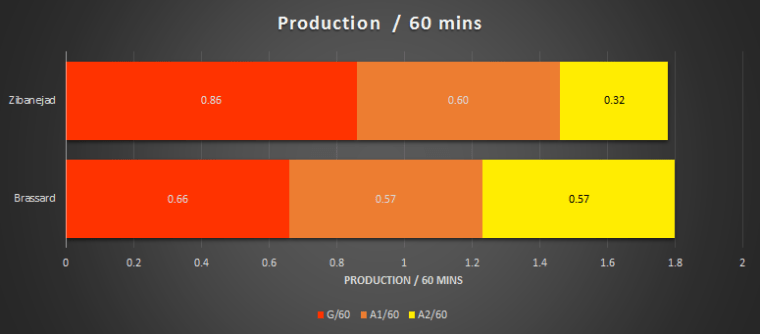
To me, Zibanejad is a clear leader in production. I throw away secondary assists (A2) because it has record keeping issues as well as repeatability issues. These two players are equal in primary assist rates (A1/60), but Zibanejad provides a major boost in goal scoring. When it comes down to their primary points / 60 (i.e., G/60 + A1/60), Zibanejad provides an 18% boost in production. Granted, these numbers won’t necessarily travel with the players, but it shows a lot of promise for an immediate 5v5 impact from Zibanejad.
Time on Ice Splits and 5v4 Production
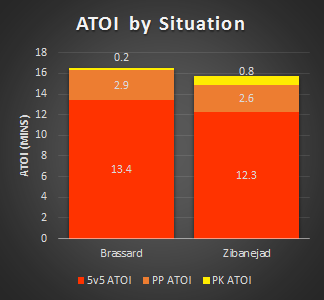 These two have very similar shares of 5v5 ice time. Brassard has only seen about one extra minute on the ice per game, but that gap has slowly dropped over the years. As can be seen from the chart to the right, both players have seen very minimal usage on the PK. I suspect that will remain the same with their new teams so I won’t look deeper into their PK abilities. However, both have seen significant usage on the PP and both will probably play an important role on the man advantage for their new team.
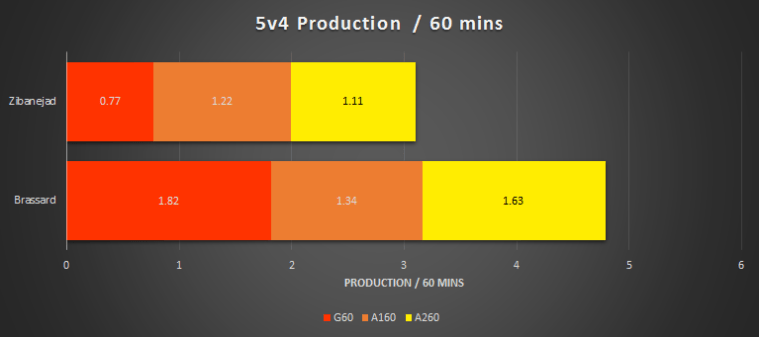
It’s likely that Brassard is better on the power play of these two. He’s got a lot more production to his name and both of his goals for (actual and expected) are better than Zibanejad’s. However, it’s tough to discern how much each team’s system plays into the results and obscures our analysis of the players themselves. The Senators as a whole have been less successful at capitalizing on man advantages than the Rangers have over this span. So I would say that Brassard is likely better at this facet of the game, but things can change drastically for these players depending on the system they’re slotted into.
Penalty Impact
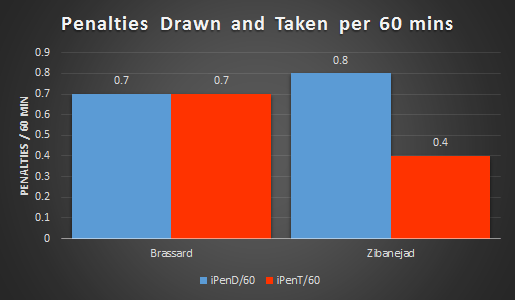
One aspect that I feel is frequently overlooked is the penalty impact on a team. Brassard has generally been a wash, creating about as much power play opportunities for as he does power play opportunities against. Zibanejad, on the other hand, puts his team on the man advantage two times for every time he goes to the box. Despite Zibanejad’s lesser success on the power play, he’s allowing his team more opportunities to win the special teams battle than Brassard has.
Faceoff Impact
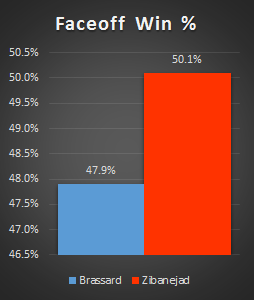
Finally, something that is important for centers but overvalued is faceoff acumen. Prior research has shown that a team gains about 2 standings points (i.e., a win) for every 245 more faceoff wins (FOWs) than faceoff losses (FOLs) during 5v5 play. For example, a team with 1,245 FOWs and 1,000 FOLs has a faceoff differential (FOD) of +245, which would be expected to give them enough extra goals that would win them one extra game. The difference between Brassard and Zibanejad is +22 FOD per 1,000 faceoffs taken. In fact, this player swap would not result in a win differential of +1 until these two players had taken 11,136 faceoffs. So yes, Zibanejad is better but the difference is negligible.
2. Statistics-Based Usage Review
As before, all of the charts to follow were constructed using 2014-16 data for 5v5 situations with zone-, score-, and venue adjustments where applicable. The data has been sourced from Corsica. I will only linger on this section briefly as these “quality” stats have issues (but are the only ones available) and the zone stats should be moot as the stats in the previous section were zone-adjusted.
Quality of Competition and Teammates

Overall, both players have very similar quality of competition (QOC) and quality of teammates (QOT). Only xGF QOT appears to have more than a negligible difference, but it’s hard to tell if it’s meaningful and the other QOT numbers are flawed or the other way around. Regardless, this does imply that the two players are deployed in a very similar fashion:
a) with other top-six forwards
b) against competition meant to shutdown top-six forwards
Zone Starts and Finishes
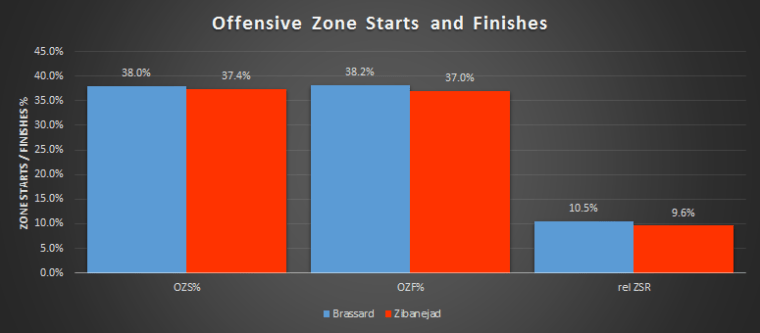
Both players received deployments skewed towards offense as shown by their offensive zone starts (OZS%). Rel ZSR is a metric that measures how many more offensive zone starts a player received compared to his teammates. The high positive value for both Brassard and Zibanejad shows that both were given more offensive zone starts than their teammates did. In addition, both were able to have about as many offensive zone finishes (OZF%) as they starter, meaning they generally kept the puck in the attacking zone.
3. Brief “Eye Test” Statements
Both players play a physical game where they are fairly likely to use their body in puck battles. However, neither player is noted as a crusher. They use their bodies more strategically, generally along the boards while protecting the puck or when supporting a teammate in a puck battle.
That said, Zibanejad definitely has a slight “power forward” nature to his game. He uses his body to create space between himself and a defender really well. He reminds me of a little bit of guys like Nash and Jagr, who can fend off guys with their sheer strength in order to make the play they want to make.
On the power play, both players have worked in a similar role. Zibanejad plays on the left-hand side of a 1-3-1. This puts him on the “off wing”, which lets him either pass to anyone in the formation or turn and rip a shot on net. Brassard has also played like a winger in a 1-3-1 system, although he tends to be on the “natural wing” side based on his handedness. But Brassard has found a lot of his production on the man advantage by slipping into the slot as the play moves and also to bang in rebounds.
This strikes me as a bit surprising. Zibanejad is a major net front presence in 5v5 play but he didn’t seem to use that skill much on the power play. I wonder if Zibanejad will have better PP production in New York by slotting across the ice like Brassard could. I also wonder if the Ottawa system is overly rigid and will hamper Brassard going forward.
One question I have going into 2016-17 is how the second lines of each respective team will change. These two have different handedness, which can really change the chemistry for each team. It could work out well for the Rangers. The left wing is their strength thanks to Nash, Kreider, and Buchnevich. A right handed center like Zibanejad could mean good passing chemistry between any of those three and him. Similarly in Ottawa, a left handed Brassard could do well on a team that boasts Bobby Ryan, Mark Stone, and Curtis Lazar on the right wing. So despite the shake ups that could occur, I think both players will have a chance to mesh well with at least one really good winger.
4. Contract, Cap, and Asset Considerations
The ultimate motive behind this trade might be Eugene Melnyk pinching pennies. The Senators will only be paying Brassard $10m over the next three years despite his $5m cap hit. Zibanejad comes with a salary of $3.25m this year and is due for a good raise in 2017 when his contract ends. He would easily have cost the Senators more than $10m over these three years had they retained him.
I recently wrote an article about a very simple cap hit prediction model using JT Miller’s new contract as a baseline. Using my model, I predict a $3.2m contract for 1-year or 2-years for Zibanejad in 2017, which would have put his salary at ~$9.6m over these three years. But I imagine that he gets signed for more and longer. It’s important to note that my model only looks at Miller’s and Zibanejad’s 2015-16 production. Zibanejad has 130 points over the last three seasons while Miller sits at 72 points (in 60 fewer games). So a team will be more at ease with compensating Zibanejad with a larger and longer contract than that. I could ultimately see Zibanejad agreeing to something around $5.0m AAV over 5 years with the Rangers. This sort of deal would lock him up for 3 RFA years and 2 UFA years, ending when he’s 29.
This proposed deal would practically be the same one given to Brassard. However, the benefit is that Zibanejad is expected to develop further while Brassard is expected to begin his decline. Using past data on the general player production peak, I formed this projection:
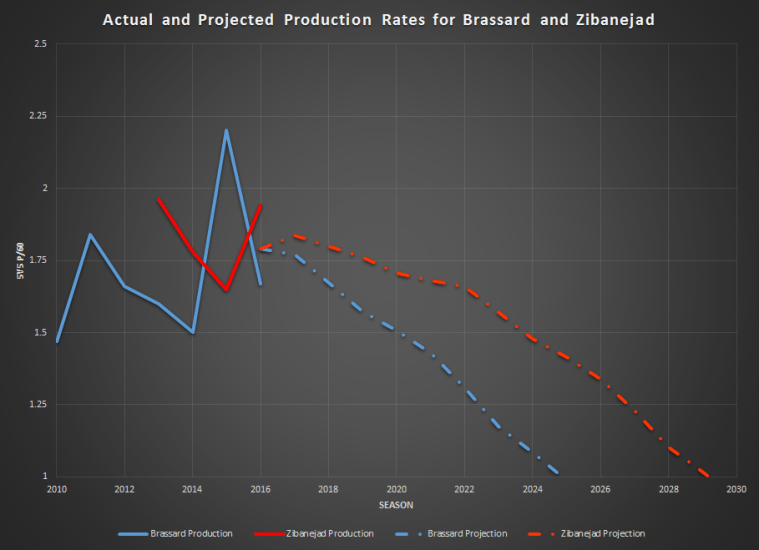
Assuming that the two perform like the average NHL forward, Brassard is a few years from starting the steeper edge of the decline while Zibanejad is a few years away from his peak. And the difference between the two players will increase every year if their production is close to the projections.
Now this curve isn’t perfect. I actually have major gripes with it, which are a part of major gripes I have with the hockey analytics right now. Specifically, it’s misleading to say that all players peak at a specific age and decline the same way. Some players are late bloomers while others make a quick splash and immediately sink. Some have skills that age well while others are out of the league by 30. Overall, I really wish the aging curve had bands that represented how 50% of players age and 90% of players age so we can see what’s “typical” and “highly typical” in our league. But I digress. I do ultimately think that these two players are far enough away in age that the idea behind this curve is accurate for them.
Lastly, the draft pick swap:
It’s hard to see (and understand without context) so here’s the low down. Sean Tierney is referencing a relative draft value chart created by Michael Schuckers of Statistical Sports Consulting. It basically starts off by saying that the #1 overall is worth 1,000 points. Then it grades the value of all the subsequent picks based off of historical success with those picks relative to the #1 overall using parameters like games played and production. Based on Schuckers’ work, the picks that were swapped had values of approximately 135 points (midpoint of the 2nd round) and 36 points (midpoint of the 7th round). While this swap certainly is to the benefit of the Rangers, the likely gain from it is pretty minimal. I would expect the Zibanejad-Brassard swap to greatly overshadow the pick swap in this trade.
5. Conclusion
Ultimately, I like this trade a lot as a Rangers fan. In many ways, Zibanejad is already as good as Brassard or better. He’s currently cheaper, he’s younger, he has similar possession numbers, has better 5v5 production numbers, and gives us cap flexibility in 2017 because we can decide how long and for how much we will want to sign him. The upgraded pick is icing on the cake. I can’t shake the feeling that this trade was 99% money-motivated in Ottawa, which is a real shame. Eugene Melnyk just jettisoned a really good player for the sake of pinching pennies. And while he got a good player back who will become a fan favorite over there as well, he has short-changed his organization once again. Overall, both teams should be pretty happy with this trade, but the Rangers have likely made the better long-term hockey move.
But the most important factor (that no one is discussing) to see how this all plays out is whether the Rangers draft Topias Töppönen out of Finland in the 2018 and move him from defense to the RW. Doing so would allow the Rangers to sport a Zuccarello-Zibanejad-Töppönen line, which could rock and roll through this league as the ZZTop Line.
Advantage: Rangers.
@Chris_Beardy is a hockey stats fan first, Rangers fan second. You can tell him how wrong he is about everything on Twitter, by email at slappersandstats@gmail.com, or on Reddit at /u/ChocolateAlmondFudge.
