The Worst Players to Play in an NHL All Star Game

The NHL All Star Game is a long and storied tradition the league that dates back to 1947 and has origins in a 1933 benefit game for Ace Bailey and his family following a career ending injury to Bailey mid-season. Since then, the game has morphed from a charity event into a celebration of the league and some of its best players. The All Star Team selections have changed over the years often in reaction to something that happened in the league. Most recently, the league restricted the fan vote selections after the fans sent John Scott to the 2016 All Star Game as a combination of a middle finger to league and a celebration of John Scott as a person and as the archetypal enforcer that is slowly being pushed out the game.

maxresdefault
Scott captained the Pacific team to a win and earned a cut of a large check. He was also selected as the game’s MVP and won a minivan for himself, his wife, and their four daughters.

The origins of the John Scott selection started as the intention to send the worst player in the league to annoy the league. Even after the movement changed and saw it as a fun change of pace to send the highly charismatic Scott to the game, many critics railed against how Scott may have been the worst player to play in an All Star Game. So that got me wondering: Is John Scott actually the worst player to play in an All Star Game?

It ends up that the history of the All Star Game format is key to answering this question. The first three All Star Games were organized as benefits following Bailey’s career ending injury in 1933, Howie Morenz’s death in 1937, and Babe Siebert’s death in 1939. Each pitted either the Toronto Maple Leafs or a combined Montreal Canadiens-Maroons squad against the league’s best players from other teams.

The All Star Game did not become an official annual tradition until the 1947-48 season. From 1947 to 1969 (except for the 1952 game), the All Star Game consisted of the previous season’s Stanley Cup champion facing off against the best of the rest in the league. After that point, the game assumed a similar format to the one we know today: Conference versus conference.

It ends up that there have been a few players to make the All Star Game by riding the coattails of a championship winning team. None of these guys are household names, but many have some significant accolades on their resume. I have compiled a group of ten players who have played in an All Star Game and I think are arguably worse than John Scott. However, the vast majority of them have been incredibly fascinating and fun in their own rights, just as Scott was during his time in the spotlight.

ssmrke10. Stan Smrke

Smrke was the first Yugoslavian player in the NHL. He landed himself on the Montreal Canadiens roster just in time to play in the 1957 All Star Game. Smrke scored a goal in that ASG, which marked the only time he would score a goal on NHL competition in 10 career games. Despite not sticking in the NHL, Smrke was a stand out player in the Quebec Hockey League and American Hockey League (AHL) with Chicotoumi and Rochester, respectively. He was inducted into the Rochester Americans Hall of Fame in 1988.

b199203s9. Frank Mathers

Mathers played his first NHL game just days after playing with the Toronto Maple Leafs in the 1948 All Star Game. He would play only 23 games for the Maple Leafs over the next four seasons. Despite this, Mathers was a prolific star in the AHL with the Pittsburgh Hornets and Hershey Bears. Over a 14 year career, he amassed 340 assists and 407 points to secure the assist and point leads among defensemen when he retired. After retiring, Mathers spent 35 years in the Hershey Bears’ front office. He has been awarded the Lester Patrick Trophey for his lifelong commitment to hockey and sits in the Hockey Hall of Fame as a builder and the AHL Hall of Fame as a player and builder.

mazur-eddie-55-56-parkie-canadiens-196_orig8. Eddie Mazur

Mazur was a member of the 1953 Stanley Cup winning Canadiens and played in the 1953-54 All Star Game with his squad. Mazur would play a total of 107 games and score 28 points as a defenseman and left wing before starting a long AHL career. Mazur is perhaps best known for having scored the most playoff goals before playing a single regular season game prior to Chris Krieder’s five goals in the 2012 playoffs. Mazur had scored four goals in 14 career playoff games across three postseasons before ever playing a single regular season game.

keith_allen_saskatoon_quakers7. Keith Allen

Allen played 5 of the Red Wing’s 12 playoff games during their 1954 Stanley Cup win and started off the next season with the Wings in the 1954 All Star Game. However, after only 33 career games he was out of the league. Allen played a lengthy AHL career as a dependable defenseman before taking a management position in hockey. Hebecame the general manager of the Philadelphia Flyers in 1969 and constructed the Broadstreet Bullies. He led the Flyers to two championships in 1974 and 1975 as “Keith the Thief”, earning himself a ticket into the Hockey Hall of Fame as a builder.

0000070176. Norm Corcoran

Corcoran played the part of a prototypical tweener in his career. He was a good AHL player who would come up to the NHL for a few games at a time before being sent down. In the summer of 1955, he was sent from Boston to Detroit as part of a nine person trade that sent Terry Sawchuk to Boston. Because Detroit had won the 1955 Stanley Cup, Corcoran was part of the 1955 All Star Game. After just two games, Detroit waived him and he was picked up by Chicago. Twenty-three games with Chicago that year was the last taste he got of the NHL. In total, he potted 1 goal and 3 assists in 33 career NHL game as a center.

499993d7b89f30715d8ae1c016f969875. Lorne Davis

Davis was a man who needed two hands for his Stanley Cup rings despite his playing career. He was a right winger who played a total of 97 NHL games over 6 seasons with only 8 goals, 12 assists, and 20 points to show for it. His only games in the 1952-53 were 7 playoff games with the Canadiens, where he acquired his first ring. He played in the NHL All Star Game at the start of the 1953-54 season. After a minor league career that had him out of the AHL before he was 30, he became an amateur scout. He scouted for the Edmonton Oilers in each of the five seasons they won the Stanley Cup, giving him a total of 6 rings.

0000072374. Bob Dawes

Dawes was a flexible player who could play both center and defenseman, albeit neither particularly well. He played 9 games with the 1948-49 Maple Leafs playoff run, which ended with a Stanley Cup win. He played in the 1949-50 All Star Game but didn’t finish the season with the Leafs. His NHL career concluded with 9 points in 32 games and he played 14 years in the minor and senior leagues before hanging up his skates.

one_costello013. Les Costello

Costello is perhaps the most intriguing entry on the list. Costello’s inaugural NHL season was on the 1948 Stanley Cup champion Leafs and played on their 1948-49 All Star Game squad. He only played one more NHL game after that, ending up with 5 points in 15 games. In 1950 Costello quit professional hockey to join a seminary. In 1963, he formed a squad of hockey playing priests called the Flying Fathers and toured with them to raise money for charity. He played with the Flying Fathers for 39 years even despite losing three toes to frostbite during a camping trip in 1979. He ultimately died in 2002 after taking a shot to the head and falling head first into the ice during a Flying Fathers game. The next day he slipped into a coma and died later that week at 74 years old.

bauman2. Garry Bauman

Bauman is our only goalie to make the list. He appeared in the 1966-67 All Star Game for the Canadiens alongside Charlie Hodge. Together, the two posted the only shutout in the history of the game. That would be the only shutout of his NHL career. Bauman played only two games for the Canadiens before being selected in the expansion draft by the Minnesota North Stars, where he would play another 33 lackluster games over two years. Bauman’s final year in the NHL ended after he allowed 4.34 goals per game over 7 games. Bauman even struggled to find work in the AHL and was done with the sport only three years after leaving the NHL.

Johnmacmillan1. John MacMillan

McMillan tops the list for a combination of reasons: First, he’s a two-time Stanley Cup winner and two-time All Star Game participant with the Maple Leafs. Secondly, he was a right winger who played 104 games over 5 seasons and contributed only 15 points and 32 PIMs. Finally, he didn’t even look particularly good in the minor leagues after his NHL career ended. MacMillan has cup rings from 1962 and 1963 and All Star Game appearances in each of the seasons following those wins. Personally, I have to call him the worst player to ever play in an NHL All Star Game simply because he honestly belongs in the top two spots on this list.

Advertisement

34.5 million reasons I’d be against compliance buyouts in the next CBA if I were a player

Escrow has been a dirty word among players for the better part of a decade now, and it’s understandable knowing that they see an extra 10%, 15%, or even 18% shaved off of their every hard earned paycheck. However, it’s a necessary evil for the revenue sharing agreement in cap system to work. As it is right now, the salary cap system is set up to overpay the players from the outset of every season. The salary cap ceiling is set to create a 57.5/42.5 revenue split between the players and league. Escrow exists to redistribute the revenue so that it is split 50/50 at the end of every year, as the NHL and NHLPA agreed upon in the 2013 CBA. So every cap team in this league is an extra little bit of escrow tagged onto the players. There are also a few other well-known causes of escrow, such as the salary cap escalator, LTIR, and cap-advantaged contracts, that are explained here.

article_76b6415e-e65d-4bde-8c18-158d09fa142d

There is, however, one unique cause of escrow spiking that I have heard little of. It is something that happened in the two years after the 2013 CBA was signed and that something is also being discussed as a likelihood in the next round of labor negotiations. That something is compliance buyouts. Compliance buyouts are get-out-of-jail-free cards for teams that don’t like one of their contracts. These buyouts still require the teams to pay the player a large percentage of his contracted salary, but there is no cap hit associated with the buyout (unlike regular buyouts). Continue reading “34.5 million reasons I’d be against compliance buyouts in the next CBA if I were a player”

Reviewing Lundqvist’s Year-to-Date Stats, January Edition

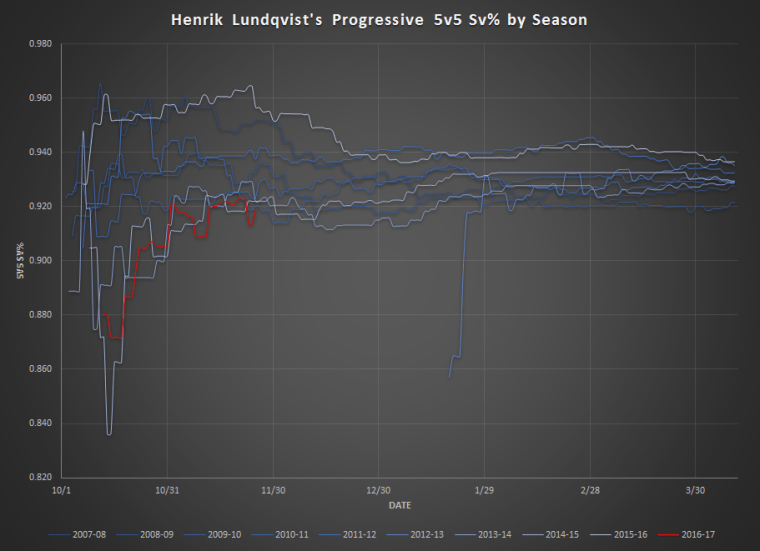
I looked at Lundqvist’s year-to-date stats back in late November and found that his play this year has been statistically weaker than every season since 2007-08 (which was the first season I could get the necessary data). I have added in the last five weeks of data and re-configured my graphs to make them a bit more reader friendly:

f8ndk55


Above is Henrik Lundqvist’s year-to-date 5v5 save percentage since 2007. This time around, I have removed all of the data from previous seasons and condensed them into three descriptive stats: minimum, average, and maximum. Continue reading “Reviewing Lundqvist’s Year-to-Date Stats, January Edition”

Lundqvist’s year-to-date stats compared to previous years.

I looked at how Henrik Lundqvist’s play (a) has compared on a year-to-year basis and (b) how it tends to progress on a year-to-date basis. I used 5v5 Sv% and expected goals saved above average per 60 mins (xGSAA/60) as my two metrics. Both sets of data came from Corsica.

I chose 5v5 Sv% because it tends to eliminate a lot of team effects. All situations Sv% can be drastically affected by special teams based on the systems play that a team employs (as well as the efficacy at pulling it off). Overall, 5v5 Sv% tends to map decently year-to-year so it’s a good metric to look at as a measure of skill.

jzsquch

I chose xGSAA/60 because it helps address the issue of shot quality. xGSAA/60 basically looks at the types and distances of the shots taken and determines how many goals a hypothetical league average goalie would give up that night (ie, expected goals). By comparing this expected goals number against Lundqvist’s actual goals allowed number, we get an idea of how he performed against a league average baseline. The “per 60 mins” part helps to normalize for time in net. This stat is also only measuring 5v5 play.

y5pyssa

I wanted to emphasize Lundqvist’s play this year against previous years as a composite so I chose colors that aren’t well differentiated for previous years (ie, 2007-16). However, if there is interest in having all of the years differentiated I can fulfill that request.

My observations:

  1. Lundqvist isn’t doing well this year. His 5v5 Sv% is among the lowest of his career for this point in the season and his xGSAA/60 through yesterday is the worst of his career. There is some teeth to the idea that he is not playing at the same level as before.
  2. His xGSAA/60 this year is very close to 0, suggesting that he is overall playing at a league average level during 5v5 play.
  3. The idea that he is a slow starter is only true for the last few years. Earlier in his career he had solid starts to the season. There’s also a noticeable dip in almost every year for December, which is likely him cooling off from what looks like to be a lot of hot Novembers (just not this year).
  4. His two best years by both stats appear to be 2015-16 and 2012-13. One year he received no votes for the Vezina while the other year he finished 2nd in voting. The Vezina voters really aren’t good at their job.

Honestly, I think it’s very fair to say we are seeing a below average performance from Hank relative to what we expect from him. This year he is facing a pretty normal mix of low-, medium-, and high-danger shots. It’s not like last year where the very high average shot quality he faced gave him average traditional stats and amazing underlying stats. Given the fact he’s coming off such a stellar season, I have a lot of hope that he can bounce back and play at a really high level this year.

However, going by the eye test I am at least a bit worried. There definitely have been games where he has let in total stinkers. And not just one stinker in one game, but a few stinkers in a few games each. But he still has long stretches where he plays solidly and makes great saves. Nonetheless, I would say there is not anything in particular that I see as an explanation for his poor play. No apparent injury or major changes in style of play. As far as I can tell, he’s more or less just playing more sloppy than usual.

Something I might investigate in the future is his progressive win threshold % (WT%) and loss threshold % (LT%). WT% is basically a measure of how often a goalie “steals games” and LT% measures how often they let in so many goals that the team in front is very unlikely to overcome it. Both are based on per game expected goals and goals against numbers. And at least for last year, he was absolutely elite by those numbers. One of the best in the NHL for both stats.

Dissecting the Odd Salary Structure of Hampus Lindholm’s Contract

Per Cap Friendly, Lindholm’s new contract has a rather odd salary structure that may confuse a lot of people:

Year Salary
2016-17 $3.00m
2017-18 $6.00m
2018-19 $6.75m
2019-20 $5.25m
2020-21 $3.75m
2021-22 $6.75m

We have generally grown accustomed to deals that are in some way flat, i.e., they may have a rising salary, uniform salary, or decreasing salary with term. And we have begun to grow used to either a salary drop in 2020-21 or an agreement that places most of that salary in signing bonuses. This latest tactic is “lockout-proofing” of contracts. So what gives with Lindholm’s tumultuous structure?

Variability Rules for Multi-Year SPCs

After all of the front-loaded deals helped set the 2012 lockout into motion, the Collective Bargaining Agreement (CBA), a labor contract between the NHL and the players’ union known as the NHLPA, came to include rules that were meant to eliminate such practices. One such set of rules is found in Section 50.7 of the CBA: Variability Rules for Multi-Year Standard Player Contracts (SPCs).

Paragraph 50.7(a) introduces the idea of “Front-Loaded SPCs.” Front-loaded SPCs are basically those aforementioned contracts that set the lockout in motion. A classic example is Marian Hossa’s contract:

Year Salary
2009-10 $7.90m
2010-11 $7.90m
2011-12 $7.90m
2012-13 $7.90m
2013-14 $7.90m
2014-15 $7.90m
2015-16 $7.90m
2016-17 $4.00m
2017-18 $1.00m
2018-19 $1.00m
2019-20 $1.00m
2020-21 $1.00m

The original intention of these deals was to drive down the cap hit of the contracts by adding on low salary years at the end of the contract that the player would skip over by retiring. The 2012 CBA negotiations sought to eliminate these contracts by (a) limiting contracts to 8 years max and (b) introducing rules for how salaries can be structured on a year-to-year basis.

So paragraph 50.7(a) introduces the following limits on Front-Loaded SPCs:

  1. Maximum of 35% change from year-to-year.
  2. Maximum of 50% change from highest-salary year to lowest-salary year.

It’s pretty clear that the Hossa deal would violate this agreement if it were signed today. And it appears at first glance that the Lindholm contract does as well. After all:

  1. It has a maximum year-to-year change of 50%, and
  2. a maximum highest-salary to lowest-salary change of 56%.

Then why was this contract allowed to go through? Well, that lies in the definition of a Front-Loaded SPC. The following process for determining if a contract is a Front-Loaded SPC is spelled out in items 50.7(a)(i)(A)-(E) of the CBA:

  1. Add up the total salary (including bonuses) of the first half of the contract. (Note: if there’s an odd number of years, take half of the “middle year.”)
  2. Divide the combined salary of the first half of the contract and divide it by half the number of years of the contract.
  3. Compare against the AAV of the full contract.
  4. If the “first half average salary” is greater than the AAV, then you have a Front-Loaded SPC.

So let’s go through this process with Lindholm:

  1. We know he has a 6-year contract with an AAV of $5.25m.
  2. So adding up and averaging the first three years of his deal: $3.00m + $6.00m + $6.75m = $15.75m.
  3. $15.75m / 3 yrs = $5.25m / yr
  4. $5.25m / yr is not greater than the AAV ($5.25m), therefore this is not a Front-Loaded SPC.

Thusly, we need to refer to the next set of rules to see what actually governs the salary structure of Lindholm’s contract. Paragraph 50.7(b) applies to all non-Front-Loaded SPCs and states:

  1. The difference in salary between the first two of the SPC cannot exceed the lower of those two salaries.
  2. A year-to-year increase cannot be greater than the lower salary of the first two years of the contract.
  3. A year-to-year decrease cannot be greater than 50% of the lower salary of the first two years of the contract.

Putting It All Together

It’s clear to see that there are many things going on with Lindholm’s contract here. To quote Walter Sobchak from The Big Lebowski, “It’s a Swiss fuckin’ watch.” Every single year is tangled with a requirement from at least one of the rules.

For starters, the first three years must sum up to no more than $15.75m in order to avoid having an average salary that does not exceed the AAV ($5.25m) of the entire contract.

Next, the first two years are specifically chosen to ensure that all of the year-to-year variability follows suit. The $3.0m and $6.0m salaries set the maximum year-to-year decrease at $1.5m (half the lower of the two salaries) and the maximum year-to-year increase at $3.0m (equal to the lower of the two salaries).

With the first two years set at a combined $9.0m, that means the third year must be $15.75m – $9.0m = $6.75m.

From there, the contract dips down as much as possible year-to-year for two years in order to create the lowest possible salary in the expected lockout year (2020-21). After two straight $1.5m decreases, the contract takes on salaries of $5.25m and $3.75m in the 4th and 5th seasons, respectively.

Finally, the last season is an attempt to have the highest possible salary, which leads to the maximum potential year-to-year increase of $3.0m. This puts the final season of the deal at $6.75m.

jkcl9c1
Relationship between different Year 1 salaries and their resultant Lockout Year salaries for Lindholm’s contract.

Every single year is optimized here. Increasing the value of the first two years results in less lockout protection, no matter how you try to arrange the salary structure within the rules. (E.g., I increased the first two years to $3.25m and $6.5m and ended up with $3.8m in the lockout year, which is $50k more than in the actual contract.) Similarly, dropping the values of the first two years will result in some exceedingly suboptimal salary structures. (E.g., I dropped the first two years to $2.75m and $5.5m, which resulted in a salary of $4.75m in the lockout year, which is not at all desired.)

Concluding Thoughts

So ultimately, we see a pretty interesting salary structure that at first glance appears funky. But after going through the applicable rules, we can see that each year is a carefully designed puzzle piece to fit this specific puzzle. Now remains only one question: Why not avoid all this nonsense by just committing all but $1m of his salary in the potenital lockout year to a signing bonus? That would have afforded more protection and without the funky contract numbers.

A Detailed Analysis of the Brassard for Zibanejad Trade

by @Chris_Beardy

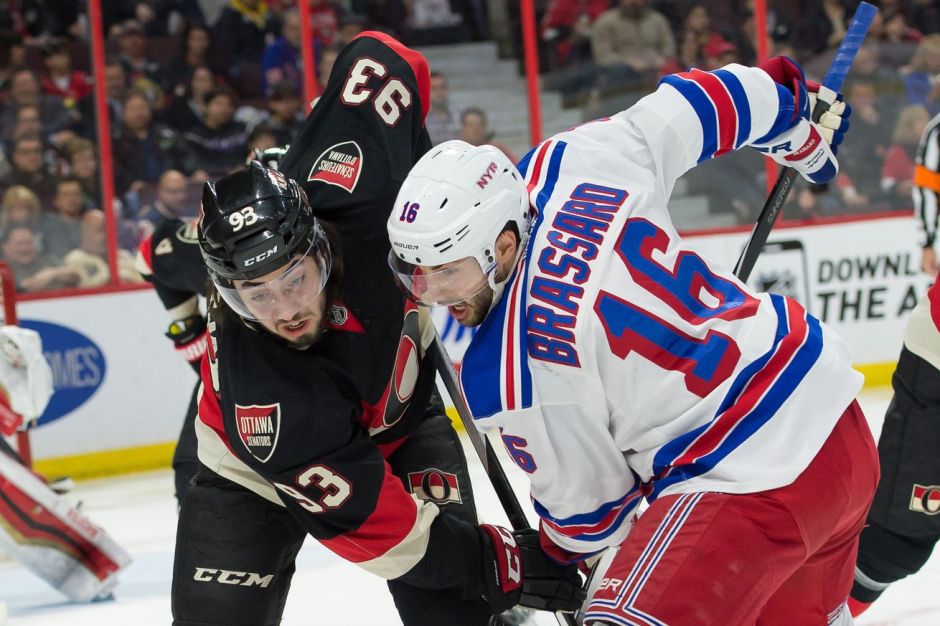
The Rangers and Senators made a very noteworthy trade on June 18, 2016:

In this post I will evaluate this trade from the perspective of a New York Rangers fan. I plan to evaluate the following aspects of this trade:

  1. Statistics-based performance review
  2. Statistics-based usage review
  3. Brief “eye test” statements
  4. Contract, cap, and asset considerations
  5. Concluding remarks

1. Statistics-Based Performance Review

Unless noted otherwise, all of the charts to follow were constructed using 2014-16 data for 5v5 situations with zone-, score-, and venue adjustments where applicable. The data has been sourced from Corsica. I will frequently use stats that say “/60”, which means the stat is adjusted to “per 60 minutes of time on ice.” This addresses any difference in time on ice by these players.

Here are some basic player data just to set the stage:

Brassard Zibanejad
Age 28.8 23.3
Height 6’1″ 6’2″
Weight 205 lbs 220 lbs
Shoots L R
GP 241 230 ( + 6 AHL)

Continue reading “A Detailed Analysis of the Brassard for Zibanejad Trade”

Estimating Arbitration Salaries Using JT Miller’s Contract Extension

By @Chris_Beardy

J.T. Miller became the first of four arbitration-bound New York Rangers to ink a deal. On July 13th, he signed a 2-yr, $2.75m AAV contract, leaving him just one year shy of UFA status. Many have proclaimed this contract is a steal for the Rangers, but I think it is right on point. I also believe it will provide a benchmark for many of the other players lined up for arbitration right now. Thus, I have used Miller’s contract to develop a simple cap hit prediction model for those other players.

Miller is being paid at market value.

@HockeyStatMiner wrote a great article for Blueshirt Banter in May that predicted:

Continue reading “Estimating Arbitration Salaries Using JT Miller’s Contract Extension”

Current Accrued Cap Advantage by Team

Above, in the featured image, you can see what I believe is an accurate set of data about teams with cap advantage currently on their books. All of the points represent the level of cap advantage currently accrued by the off season of any given year. For example, the Chicago Blackhawks have $31.6m in cap advantage on their books at the time of the 2016 off season. This number will be true until the first day of the season (Oct. 12), when the AAV and salary numbers stick ticking up for the 2016-17 season. I have tried graphing the correct day-to-day changes of the contracts, but it just comes out overly complicated. It’s only really important when either trades or contract terminations occur mid-season; that makes up only about 25% of events that affect cap advantage accrual to date.

You can find an interactive version of this chart here.

If there is a problem (or praise) you’d like to share with me about this different service I am trying out, please contact me at @Chris_Beardy on Twitter, by comment below, or even on Reddit at /u/ChocolateAlmondFudge.

Cap Advantage Recapture Penalty, Part 4½: The Predators Might Be Safe After All

@Chris_Beardy

Yesterday I introduced Part 4 of my series on the Cap Advantage Recapture Penalty (CARP), detailing a way the League could help the Predators out of their Shea Weber cap advantage situation using available cap space in previous seasons. Today I will provide a more simple and perhaps more likely solution to the Predators’ possible future woes.

(Just a quick note, my first, second, and third posts on this topic can be found at the links provided. I highly suggest giving them a read if you need some background info on what the CARP is and how it works.)

The Collective Bargaining Agreement (CBA), which introduced the CARP has a rather straightforward passage that might be interpreted to help the Predators:

Section 50.5(d)(ii)(B)(2):Notwithstanding the provisions of Sections 50.5(d)(ii)(A) and (B), in the event that any such Long-Term Contract is Assigned during its term, each Club for which the Player plays under the terms of that Long-Term Contract shall be subject to being charged with any and all “Cap Advantage Recapture” amounts it receives pursuant to that Long-Term Contract, provided, however, that if a Club Traded a Long-Term Contract prior to the execution of this Agreement (including any binding Memorandum of Understanding) under which it gained a “cap advantage,” the “Cap Advantage Recapture” shall not apply to that Club for that Long-Term Contract. For purposes of clarity, the Club to whom such Long-Term Contract was Assigned after the execution of this Agreement (including any binding Memorandum of Understanding) shall be subject to the Cap Advantage Recapture (if any).

[emphasis in the original text]

To put it more simply: Contracts that could incur a CARP that were acquired by trade prior to the signing of the 2013 CBA will not accrue cap advantage against the recipient team.

Continue reading “Cap Advantage Recapture Penalty, Part 4½: The Predators Might Be Safe After All”

Loophole Avoided: Growing the Performance Bonus Cushion with the LTIR Exception to the Upper Limit

One thing I’ve grown to appreciate is the ability of teams to find loopholes in the current Collective Bargaining Agreement. It’s fun to see how teams find a way to give themselves an upper hand over other teams (at least, until the other teams follow suit). Just now, while perusing the CBA, I came across a piece of text that could have easily been a loophole had the NHL not been more careful:

Section 50.5(h)(ii): A Club shall be permitted to have an Averaged Club Salary in excess of the Upper Limit resulting from Performance Bonuses […] provided that under no circumstances may a Club’s Averaged Club Salary so exceed the Upper Limit by an amount greater than the result of seven-and-one-half (7.5) percent multiplied by the Upper Limit (the “Performance Bonus Cushion”).

The key here is that the Performance Bonus Cushion is an allowed exceedance over the Upper Limit (more popularly known as the cap ceiling or salary cap). It does not actually change the Upper Limit. This is also the case for the Bona Fide Long-Term Injury/Illness Reserve, typically referred to as the LTIR. It is described in detail in Section 50.10(d) of the CBA:

Section 50.10(d): […]  the [LTIR] replacement Player Salary and Bonuses of such additional Player(s) may increase the Club’s Averaged Club Salary to an amount up to and exceeding the Upper Limit, solely as, and to the extent and for the duration, set forth below […]

Just like the Performance Bonus Cushion, the LTIR allows teams to exceed the Upper Limit, but does not actually change the Upper Limit for that team. So why is this a big deal?

orr-side-12393
A picture of Bobby Orr probably plotting something.The metal statue in the back is likely a prototype of his cybernetics before he attempts the full conversion.

Well, let’s make up a scenario where a team can expect to have a significant amount of performance bonuses to pay out for a specific year. Let’s say that in the near future, bionic technology is mastered and Wayne Gretzky and Bobby Orr are both implanted with cyborg technology, allowing them to play at a level beyond their peaks during their dominant careers. They’re both 35+ and thus can qualify for performance bonuses of up to a maximum of $2.85m each. At $5.7m total in bonuses, you’re already at 7.8% of the 2016-17 Upper Limit of $73.0m. So what could you do? Well, if the LTIR actually changed your team’s Upper Limit then you could maneuver a player or two onto the LTIR to create $3.0m worth of cap relief. This would up your Upper Limit to $76.0m and increase your maximum allowed Performance Bonus Cushion up to exactly $5.7m.

More realistically, we see a team that has an Aaron Ekblad type of player on an Entry Level Contract (ELC) as well as a Jaromir Jagr level talent on a 35+ Standard Player Contract (SPC). And in addition, you have other lesser players on ELCs and 35+ SPCs that reach only a fraction of their potential Performance Bonuses. For example, Michal Roszival got $200k for reaching his games played threshold in 2015-16 with the Blackhawks while Teravainen made $850k for reaching various bonus milestones that same year. Panarin earned the maximum of $2.85m for the bonuses he earned. So the need for additional Performance Bonus Cushion wouldn’t be too far-fetched in my opinion.

Fortunately, this loophole is addressed with the nature of the CBA. These two mechanisms seem to have been carefully constructed to avoid this sort of shenanigans. (In addition, the Performance Bonus Cushion overage ends up rolling over to the next year’s salary cap so my hypothetical situation would have repercussions.) However, there are many incredibly smart individuals out there now working on ways to break the system for their own benefit and it will be very exciting to see how they do it.