
For at least the last two years, the idea has been floated around that the New York Rangers play two different games: one when Lundqvist is in the net and one when he isn’t. That idea goes on to posit that the New York Rangers who show up when Lundqvist is off the ice is a much better team. Those Rangers create more offense knowing that they can’t just grind out low scoring, one goal games, and they play a tighter defensive game knowing that the King can’t just bail them out when they misstep. Overall, they play a better game of hockey without their safety net.
In this article I intend to begin looking into the notion that a team plays differently depending on who the goalie in net is. I will do so by examining something less directly tied to the goalie position. I will be looking at the GF60 and CF60 rates of three separate teams split based on whether their franchise goalie is in the net or not.
The Narrative Behind it All

This idea isn’t without some cursory evidence. The Rangers were without Lundqvist for a sizable stretch in the 2014-15 season. A puck to the neck caused Hank to miss all of the Rangers’ games between Feb. 4th and March 26th, which was a 26-game stretch. Cam Talbot went on to shoulder much of the weight as the interim starter and ultimately he put up a great 0.926 performance. However, an early story line was the unexpected goal support from the Rangers for Talbot. From Feb. 10th to Feb. 22nd, the Rangers logged 33 goals in 7 games. And while they came back to earth shortly thereafter, the goal support still seemed to be there more for their goaltenders who aren’t named Hank. Talbot and MacKenzie stood in net for 38 games where the Rangers put up 3.04 GF60. Lundqvist received the slightly lower goal support of 2.89 GF60 over the course of 46 appearances. That came out to an extra 5.2% goals for Talbot and MacKenzie, which is an extra goal every 7 or so games.
Less Narrative, More Data and Graphs
I began by pulling 5v5 TOI, GF, and CF data for the New York Rangers’ goalies’ individual seasons from 2010-16, excluding 2012-13 (because the sample size is small for the lockout year). The data for guys besides Lundqvist were merged into a composite for each year.
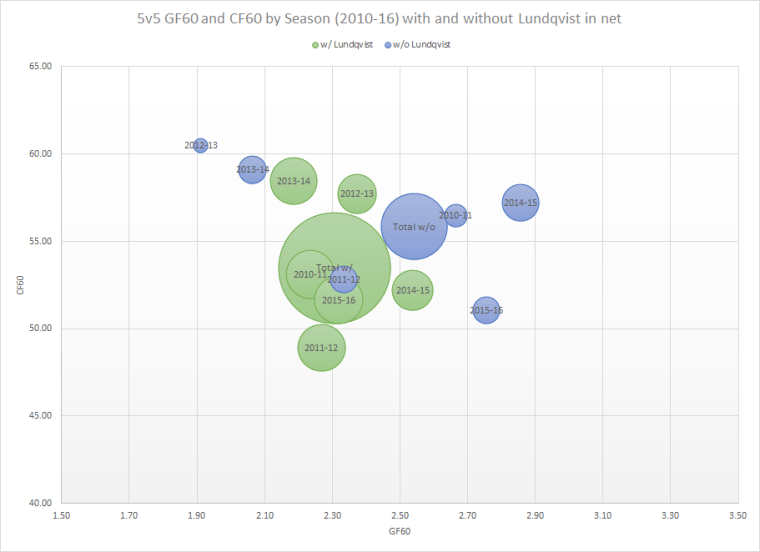
The differences between the totals over these five seasons ended up being much larger than I expected. The Rangers scored an extra 0.23 GF60 in 5v5 play and generated 2.4 CF60 extra in 5v5 play when Lundqvist was on the bench or otherwise not playing. And in fact, the GF60 and CF60 data on a year-by-year basis was higher for the backups in 4 of the 5 seasons. The 5-year TOI totals were 16,202 min with Lundqvist and 5,758 min without. On a year-to-year basis, the TOI ranged from 2,225 to 3,088 min with Lundqvist and 743 to 1,785 min without. So the samples are decent in size.
Now, I do think this is compelling evidence that for some reason the Rangers are generally performing slightly better without Lundqvist in net. However, it is not possible to discern a reason from this data. Perhaps the players actually are more motivated to generate offense because they do not have their safety net. Perhaps the team’s coaches have made measurable changes to their personnel choices, such as decisions that are meant to try and keep the puck in the attacking zone. Perhaps the goalies themselves have significant contributions to the production, such as through stick handling.
To try and learn more about this apparent phenomenon, I investigated whether this situation has arisen on other teams. I chose to look at Nashville with Pekka Rinne and Chicago with Corey Crawford. Nashville, I thought, would provide a close parallel to the Rangers as both teams has generally been centered on an elite workhouse goaltender with a below average offensive team to support him. Chicago was to provide a stark contrast where I felt that Crawford was only depended upon to consistently deliver acceptable results and was infrequently leaned on to steal games. The Blackhawks tend to depend more on their offensive capabilities than the Rangers or Predators do, meaning that goaltending need not be as prized in Chicago.


The results were quite contrary to my expectations. The Predators, who seemingly would need to emphasize offense more without their star goaltender in net instead have mostly faltered in Rinne’s absence. Chicago, on the other hand, ramped up their production when they didn’t have their starter in net. It seems that the Blackhawks seek to capitalize more on their scoring opportunities to help support their backups.
Below is another look at the data. These graphs give direct year-by-year comparisons of the data for all three franchises with and without their starting goalie:


The GF60 data seems really noteworthy. For all three teams, 4 of the 5 dots fall on one side of the line. In the case of the Rangers and Blackhawks, they fall above the line, where offense is up when the starter is out. The Predators see a dip in production on all but one year when Rinne is off the ice.
The CF60 data mirrors the trend for the Rangers and Predators. However, the Blackhawks see their CF60 drop in 3 of the 5 years without Crawford in the net. This is starkly different than what was seen in the GF60 data.
Closing Statements
I intend to investigate this idea further with other teams that have had a consistent starter across the past six-year period (e.g., Pittsburgh, Los Angeles, Dallas, etc). I will avoid teams that have significantly switched their starters in that period to try and avoid adding yet another set of variables into this analysis. Even someone like Lehtonen will be pushing it as he has effectively gone from being the #1 goalie in Dallas to a 1A/1B goalie this past year.
I know the Rangers better than I do any other team in the league so they would be the best team for me to dig deeper on this matter. I have a suspicion that personnel choices by the coaches may be a significant driver of what was observed for the Rangers. However, failing that I can also look into “puck luck” in those games. It is possible that what we’re seeing is just an aberration by pure chance.
Ultimately I think something like this could be an important part of understanding how a major roster change could affect a team in indirect ways. There could be an argument made that moving Lundqvist for a slightly above goalie could be a better change than would be expected than just by the GA60 and salary cap impacts. There is evidence that that a slight GF60 bump could occur, which would in part mask a rise in GA60.
