
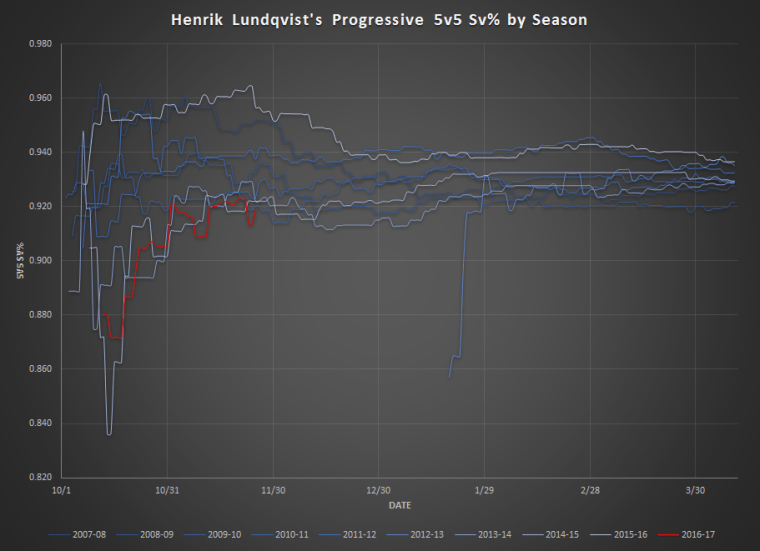
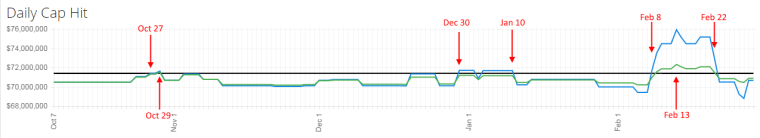
I looked at how Henrik Lundqvist’s play (a) has compared on a year-to-year basis and (b) how it tends to progress on a year-to-date basis. I used 5v5 Sv% and expected goals saved above average per 60 mins (xGSAA/60) as my two metrics. Both sets of data came from Corsica.
I chose 5v5 Sv% because it tends to eliminate a lot of team effects. All situations Sv% can be drastically affected by special teams based on the systems play that a team employs (as well as the efficacy at pulling it off). Overall, 5v5 Sv% tends to map decently year-to-year so it’s a good metric to look at as a measure of skill.
I chose xGSAA/60 because it helps address the issue of shot quality. xGSAA/60 basically looks at the types and distances of the shots taken and determines how many goals a hypothetical league average goalie would give up that night (ie, expected goals). By comparing this expected goals number against Lundqvist’s actual goals allowed number, we get an idea of how he performed against a league average baseline. The “per 60 mins” part helps to normalize for time in net. This stat is also only measuring 5v5 play.

I wanted to emphasize Lundqvist’s play this year against previous years as a composite so I chose colors that aren’t well differentiated for previous years (ie, 2007-16). However, if there is interest in having all of the years differentiated I can fulfill that request.
My observations:
- Lundqvist isn’t doing well this year. His 5v5 Sv% is among the lowest of his career for this point in the season and his xGSAA/60 through yesterday is the worst of his career. There is some teeth to the idea that he is not playing at the same level as before.
- His xGSAA/60 this year is very close to 0, suggesting that he is overall playing at a league average level during 5v5 play.
- The idea that he is a slow starter is only true for the last few years. Earlier in his career he had solid starts to the season. There’s also a noticeable dip in almost every year for December, which is likely him cooling off from what looks like to be a lot of hot Novembers (just not this year).
- His two best years by both stats appear to be 2015-16 and 2012-13. One year he received no votes for the Vezina while the other year he finished 2nd in voting. The Vezina voters really aren’t good at their job.
Honestly, I think it’s very fair to say we are seeing a below average performance from Hank relative to what we expect from him. This year he is facing a pretty normal mix of low-, medium-, and high-danger shots. It’s not like last year where the very high average shot quality he faced gave him average traditional stats and amazing underlying stats. Given the fact he’s coming off such a stellar season, I have a lot of hope that he can bounce back and play at a really high level this year.
However, going by the eye test I am at least a bit worried. There definitely have been games where he has let in total stinkers. And not just one stinker in one game, but a few stinkers in a few games each. But he still has long stretches where he plays solidly and makes great saves. Nonetheless, I would say there is not anything in particular that I see as an explanation for his poor play. No apparent injury or major changes in style of play. As far as I can tell, he’s more or less just playing more sloppy than usual.
Something I might investigate in the future is his progressive win threshold % (WT%) and loss threshold % (LT%). WT% is basically a measure of how often a goalie “steals games” and LT% measures how often they let in so many goals that the team in front is very unlikely to overcome it. Both are based on per game expected goals and goals against numbers. And at least for last year, he was absolutely elite by those numbers. One of the best in the NHL for both stats.


