Challenge Accepted: Can you find three players who, between the three of them, have played for all 30 teams?

Yesterday someone posed the following challenge on the /r/hockey community:

Can you find three players who, between the three of them, have played for all 30 teams?

The challenge was pretty simple. The 30 teams were the 30 active NHL franchises. (So someone who played for the Atlanta Thrashers would count as a Winnipeg Jet, etc.) I made it a personal rule to exclude WHA seasons so that means WHA-era Edmonton Oilers, Quebec Nordiques, etc., were out of the picture. Only NHL seasons with those franchises would count.

And when it became apparent that the challenge could not be answered favorably, I decided to figure out the maximum number of teams I could cover with different sized combinations of players. The results are as follows:

One Player – 12 Teams

hapiqx5

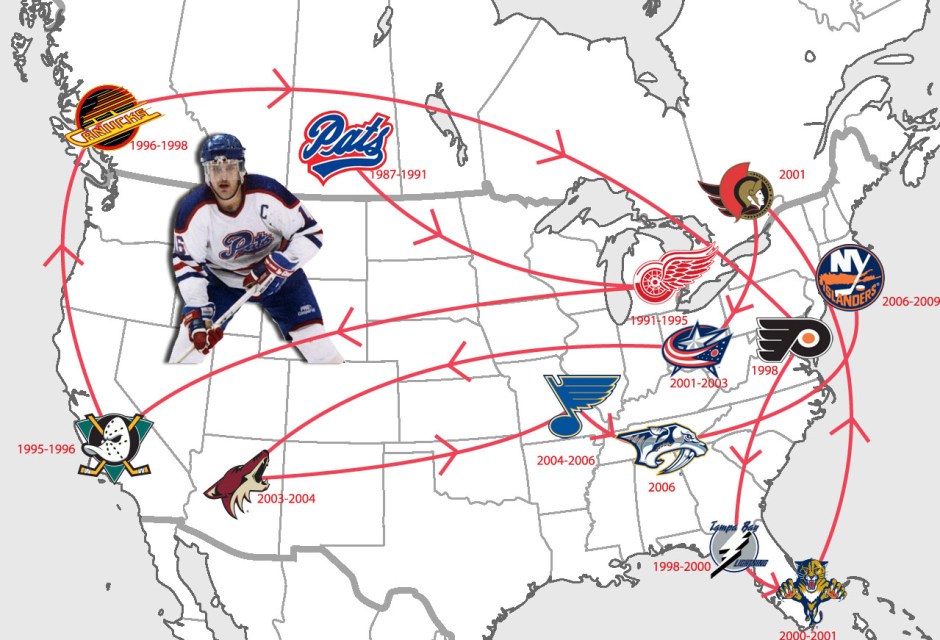
This was an easy one. Most hockey fans know that Mike Sillinger is the king of the suitcase. Over his 17 season NHL career he played 1,049 games spread across 12 different teams. He was involved in 10 separate trades. He never spent more than 4 seasons with a single team (Detroit – although he only played 3 games in his inaugural season) and maxed out at 155 games with a single team (Columbus).

The next closest players have all played for 10 teams: JJ Daigneault, Jim Dowd, Olli Jokinen, Michel Petit, and Mathieu Schneider.

Two Players – 19 Teams

fkytyeq

There are four such pairs of players in NHL history who have played for 19 different franchises between them. And all of these pairs share Mike Sillinger in common. His companions here are Jim Dowd, Bryan Marchment, Dominic Moore, and Lee Stempniak.

So the futures for Moore and Stempniak could see them moving their respective pair up to top spot in this category if they move on to the right team next year. Stempniak’s resurgence with the Devils and continued success with the Bruins should help him land a contract next year (at the tender age of 34). Moore, despite being 36 next year, could possibly find a new home. He still has a good reputation as a dependable fourth line center in this league.

Three Players – 25 Teams

yfzbtah

hd6bku8
Full size – The data table for players who played for 9+ NHL teams. (Carl Voss played for four teams that are now defunct.)

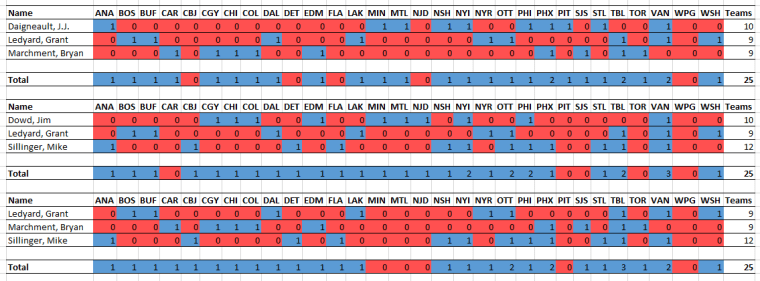
So the original challenge: 30 teams among 3 players. Can’t even get close. We top out at 25 teams in three separate trios. Even more shocking: The first one listed does not contain Mike Sillinger! Instead, they all share Grant Ledyard. Ledyard played 18 seasons in the league spread among 10 different teams. He did play five years each with Dallas and Buffalo in the middle of his career, but the bookends of his time in the league involved a lot of roaming. The trios were:

  • JJ Daigneult, Grant Ledyard, Bryan Marchment
  • Jim Dowd, Grant Ledyard, Mike Sillinger
  • Grant Ledyard, Bryan Marchment, Mike Sillinger

Ledyard probably ended up in all three lists because of the teams he played for. Among the 24 players who played for 9+ teams, it was most difficult to find players for Columbus (only 1 player), Buffalo (2 players), and Washington (3 players). Sillinger was great because he had played for Columbus, but a lot of his other destinations were places that had had 8+ other players play there. As a result, he was prone to “overlapping.” Ledyard played with Buffalo and Washington and played mostly for teams with 6 or less other “overlappers.”

Four Players – 29 Teams

a8mjrtw

This outcome totally sucks. With Carter Anson, Dominic Moore, Mike Sillinger, and Jarrod Skalde, I maxed out at only 29 teams! Why are you doing this to me Colorado? Fortunately Dominic Moore is still active so there is that teeny, tiny chance that this gets fixed next year, but I doubt it.

Calculating this with four players required me to move towards a programming solution. I did find a 25-team trio running through combinations in Excel, but I was not able to exhaust my search that way. And then I found a source that let me expand my pool to players with 8+ teams on their resumes, which put this all out of the reach of handwork.

jhpxl1m
Full size

I had a 54 player pool, which meant I would have to run through 316,251 different combinations. So I wrote a script in python to do it for me and keep track of the results. The frequency of the results can be found in the chart to the right. The data seems to be normally distributed with a mean of approximately 21.5. (Or maybe it’s more like a binomial distribution? I’m bad at stats so please correct me.) The range of the data is from 14 to 29.

Five Players – 30 Teams

As can be deduced from the previous section, you can easily find five players who, between them, have played on all 30 active franchises. There are literally hundreds of combinations stemming off the Anson + Moore + Sillinger + Skalde quartet above. And I would not be surprised to know there are hundreds or even thousands more that can be formed with any of the 54 quartets that cover 28 teams, the 509 quartets that cover 27 teams, etc.

Disclaimer

So it’s worth noting that the player pool I worked with only included those who had played for 8 or more NHL teams in their career. In the 54 player pool I used in my programmatic approach, I removed players with less than 8 teams due to defunct teams (e.g., Carl Voss) or from “doubled up” teams due to relocations (e.g., Hartford moving to Carolina).

I can confidently stand by my one player result for obvious reasons. My two player result cannot be beaten by a player with 7 or less teams to their credit, but it could possibly be tied. So both of those results as a maximum number will stand.

But I cannot rule out the possibility of there being higher results for three or four person combinations. A 7-team player and any of the four pairs that cover 19-teams could possibly form a 26-team trio. Similarly, Sillinger and two 7-team players could also reach 26. Similarly for quartets, there are a number of scenarios in which including 7-, 6-, or even 5-team players could lead to covering all 30 teams. And considering how much the player pool grows when going down as far as 5-teams, it becomes slightly plausible that a 30-team quartet does indeed exist.

So overall, I have an interest in adding 7-team player data to my set to determine what effect it might have on the results. I don’t see it being a challenge programmatically; the challenge seems to be finding an easy enough data source to work with. However, if I need to dive down into 6-team and 5-team data sets I might start encountering some challenges with my limited programming knowledge.Nonetheless, if any of you know where I might be able to come across helpful data sets, please let me know.

Advertisement

Clarifying the Long-Term Injured Reserve (LTIR)

The collective bargaining agreement (CBA) agreed to by the NHL and NHL Players’ Association (NHLPA) in 2013 describes how a player can be placed on the LTIR, how this status effects his team’s cap situation, and what can be done with the player after receiving this status. In this post, I will describe how the LTIR status is granted, how it interacts with the salary cap, and provide an example of it being used in the league.

How does a player get placed on the LTIR?

The LTIR is specifically defined in Article 50.10(d) in the 2013 CBA. A player is eligible to be placed on the LTIR if the player has been determined to be unfit to play by the team’s physician for a minimum of 24 days and 10 regular season games. In the league believes that a player is being placed on the LTIR in bad faith, the league can issue a challenge. In this situation (which to my knowledge has not yet happened), the NHL and the NHLPA would select a neutral physician to evaluate the player and make a ruling.

lcnxrvu
The form needed to put a player on the IR.

What is described above is effectively a special version of the injured reserve (IR), which only requires an expectation that the player will be out for 7 days. Another key difference between the two is that the IR can be triggered retroactively and only creates a maximum roster size exception. The LTIR cannot be deemed retroactively and it can create exceptions to both the maximum roster size and the salary cap ceiling. Both statuses for a player can be designated using the form found as Exhibit 28 in the CBA, which is shown off to the side. A team would simply need to fill out this form and submit it to the NHL Central Registry and NHLPA.

Once the NHL Central Registry has approved the LTIR status, the team is allowed to add a replacement player or players to its roster.

How does the LTIR effect the salary cap?

The trickiest thing about the LTIR is determining how it effects the salary cap for a team.  Article 50.10(d) in the CBA actually provides eight separate examples to demonstrate the “Bona-Fide Long-Term Injury/Illness Exception to the Upper Limit [of the Salary Cap].” Interestingly enough, the LTIR exception and the performance bonus cushion (another post for another day) create the only two exceptions to the salary cap ceiling during the regular season.

Perhaps the biggest misconception about the LTIR is that the player’s cap hit does not get removed from the team’s payroll. In fact, what happens is that the team is allowed to exceed the designated salary cap ceiling by as much as the cap hit of the contract for the player entering the LTIR. The value of the allowed overage is determined on the day that the player is moved to the LTIR. That player on the LTIR both continues to count towards the cap and continues to receive his salary. Article 50.10(d)(ii) specifically states

“The Player Salary and Bonuses of the Player that has been deemed unfit-to-play shall continue to be counted toward the Club’s Averaged Club Salary [….]”

The next Article, 50.10(d)(iii), states that

“The total replacement Player Salary and Bonuses for a Player or Players that have replaced an unfit-to-play Player may not in the aggregate exceed the amount of the Player Salary and Bonuses of the unfit-to-play Player who the Club is replacing[.]”

Finally, Article 50.10(d)(iv) states that

“[….] A Club may then exceed the [salary cap ceiling] due to the addition of replacement Player Salary and Bonuses of Players who have replaced an unfit-to-play Player, provided, however, that when the unfit-to-play Player is once again fit to play [including any time spent on a conditioning loan], the Club shall be required to once again reduce its Averaged Club Salary to a level at or below the [salary cap ceiling] prior to the Player being able to rejoin the Club [….]”

[emphasis in the original]

How has the LTIR been used in the league?

Thanks to Cap Friendly, I have found a resource that makes it a lot easier to show how the LTIR has been used this year by the Toronto Maple Leafs. They have engaged in some really interesting work with regard to cap and asset management through the use of a significant number of tools, including the LTIR. Below you can see a timeline of Nathan Horton’s status with the team over the course of the season. Most notably, he was moved from the Injured Reserve to the Long-Term Injured Reserve on October 27, 2015.

zkzrg5v

Now there had been little question from before the season that Nathan Horton was not planning to make any return to the ice. Unfortunately, he likely has career-ending medical issues, but he likely will not be retiring. It is neither in his interest (since he will continue to be paid on the LTIR) or in the interest of the Maple Leafs (for the reasons to come below) for Horton to retire at this time.

Thus the question should be asked why the Maple Leafs did not place Nathan Horton on the LTIR at the start of the season. That can illustrated with the graph below:

dobqmv1

The black line represents the salary cap ceiling for the Maple Leafs. The blue line is their daily cap hit and the green line is a projected cap hit for the team at the end of the year. A team’s final salary cap number at the end of the year is actually the average of all their daily cap hits. The projected cap hit is that running average assuming that the current day’s cap hit were to be maintained through the end of the season.

Under normal cases, neither the blue nor the green lines are permitted to go over the black line at any single point during the season. So a team cannot operate at 150% of the salary cap ceiling for half the year and 50% of it the rest of the year to even out at 100%. No, teams must remain below the salary cap ceiling at all times. Unless they have one of two exceptions: an LTIR exception or a performance bonus cushion exception.

As mentioned above, the Maple Leafs can receive a salary cap ceiling exception equal to the overage created by the Horton contract after putting replacement players on their roster (whose total contract values cannot be greater than that of Horton’s contract), which occurs immediately after Horton is placed on the LTIR. At the start of the season, the Maple Leafs were operating at a projected $70.48m cap hit. If they had placed Horton on the LTIR at that point and fully replaced him, they could have created a maximum allowed overage of $4.38m. Instead, the Maple Leafs waited. Then on October 27, 2015, they called up Casey Bailey from the AHL (at a time when they had three players on the regular IR and needed a call-up), which put an additional $0.91m against the cap. This put the Leafs’ projected cap hit only $93,306 beneath the salary cap season. So they placed Horton on the LTIR at that point, granting them an allowed overage of up to $5,206,694 for as long as Horton is on the LTIR. (Note: Horton’s contract lasts through the 2019-20 season.) Thus, the Maple Leafs effectively have a salary cap ceiling of $76.6m while almost every other team can only spend up to $71.4m this year. (Note: Casey Bailey was back in the AHL after only two days up with the Maple Leafs. He arguably was only called up for this LTIR move.)

And so it can be seen that the Maple Leafs have used this allowed overage four separate times this year:

  1. On October 29, 2015, they returned Casey Bailey to the minors, called Byron Froese up to the NHL, and signed Richard Clune. Overall, those moves put the Leafs at $71.5m, just slightly over the normal salary cap ceiling. This only lasted for a single day.
  2. From December 30, 2015, to January 10, 2016, the Maple Leafs were at $71.7m in salary after an emergency call up of Mark Arcobello and Antoine Bibeau. (Both were sent back to the minors on January 3, 2015, for some reason but promptly returned to the NHL on the next day.)
  3. From February 8, 2016, to February 22, 2016, the Maple Leafs were well above the normal $71.4m salary cap ceiling. One of the main factors was the trade that sent Phaneuf out of town (along with four other players in the AHL) in exchange for four Senators players. The exchange ultimately added $1.8m to the Maple Leafs’s salary cap. Around that same time frame, Tyler Bozak, Joffrey Lupul, and Jared Cowen (from the aforementioned trade) were all placed on the IR and required roster replacements. The Leafs ultimately carried a maximum salary cap of $75.9m on February 13, 2016. This used up $4.5m of the LTIR exception. Had Horton been placed on the LTIR at the start of the season, these roster moves could not have been done this way.
  4. Not pictured above (because I made the image before all roster transactions were completed) is the Maple Leafs ending February 29, 2016, with about $440k above the normal cap ceiling. This is mainly related to them calling up a large number of their minor league prospects including Kasperi Kapenen and William Nylander.

Finally, it should be mentioned that sometimes the contract of a player on the LTIR can itself become a good asset. We saw that happen this past summer when Marc Savard was involved in a trade that sent him from the Boston Bruins to the Florida Panthers. The thing is: Savard has not played a single game since 2010-11, when he received a career ending concussion. So he had spent his entire time in Boston after his injury on the LTIR, which makes cap management a bit more complicated for the reasons described in detail above. However, Florida found his contract attractive as a cash-strapped team because it added $4.0m to their cap while only costing them $575k in real money each year. This helped Florida reach the salary cap floor. It was a move beneficial for both sides because now Boston has that $4.0m unlocked without having to do tricky movement of their assets.

So what next?

Well if you made it this far, you’re clearly interested in how the intricacies of the CBA. Consider taking a look at my three-part series covering the cap advantage recapture penalty. It’s just as good of a read and it covers an equally important but obscure mechanism described in the 2013 CBA.